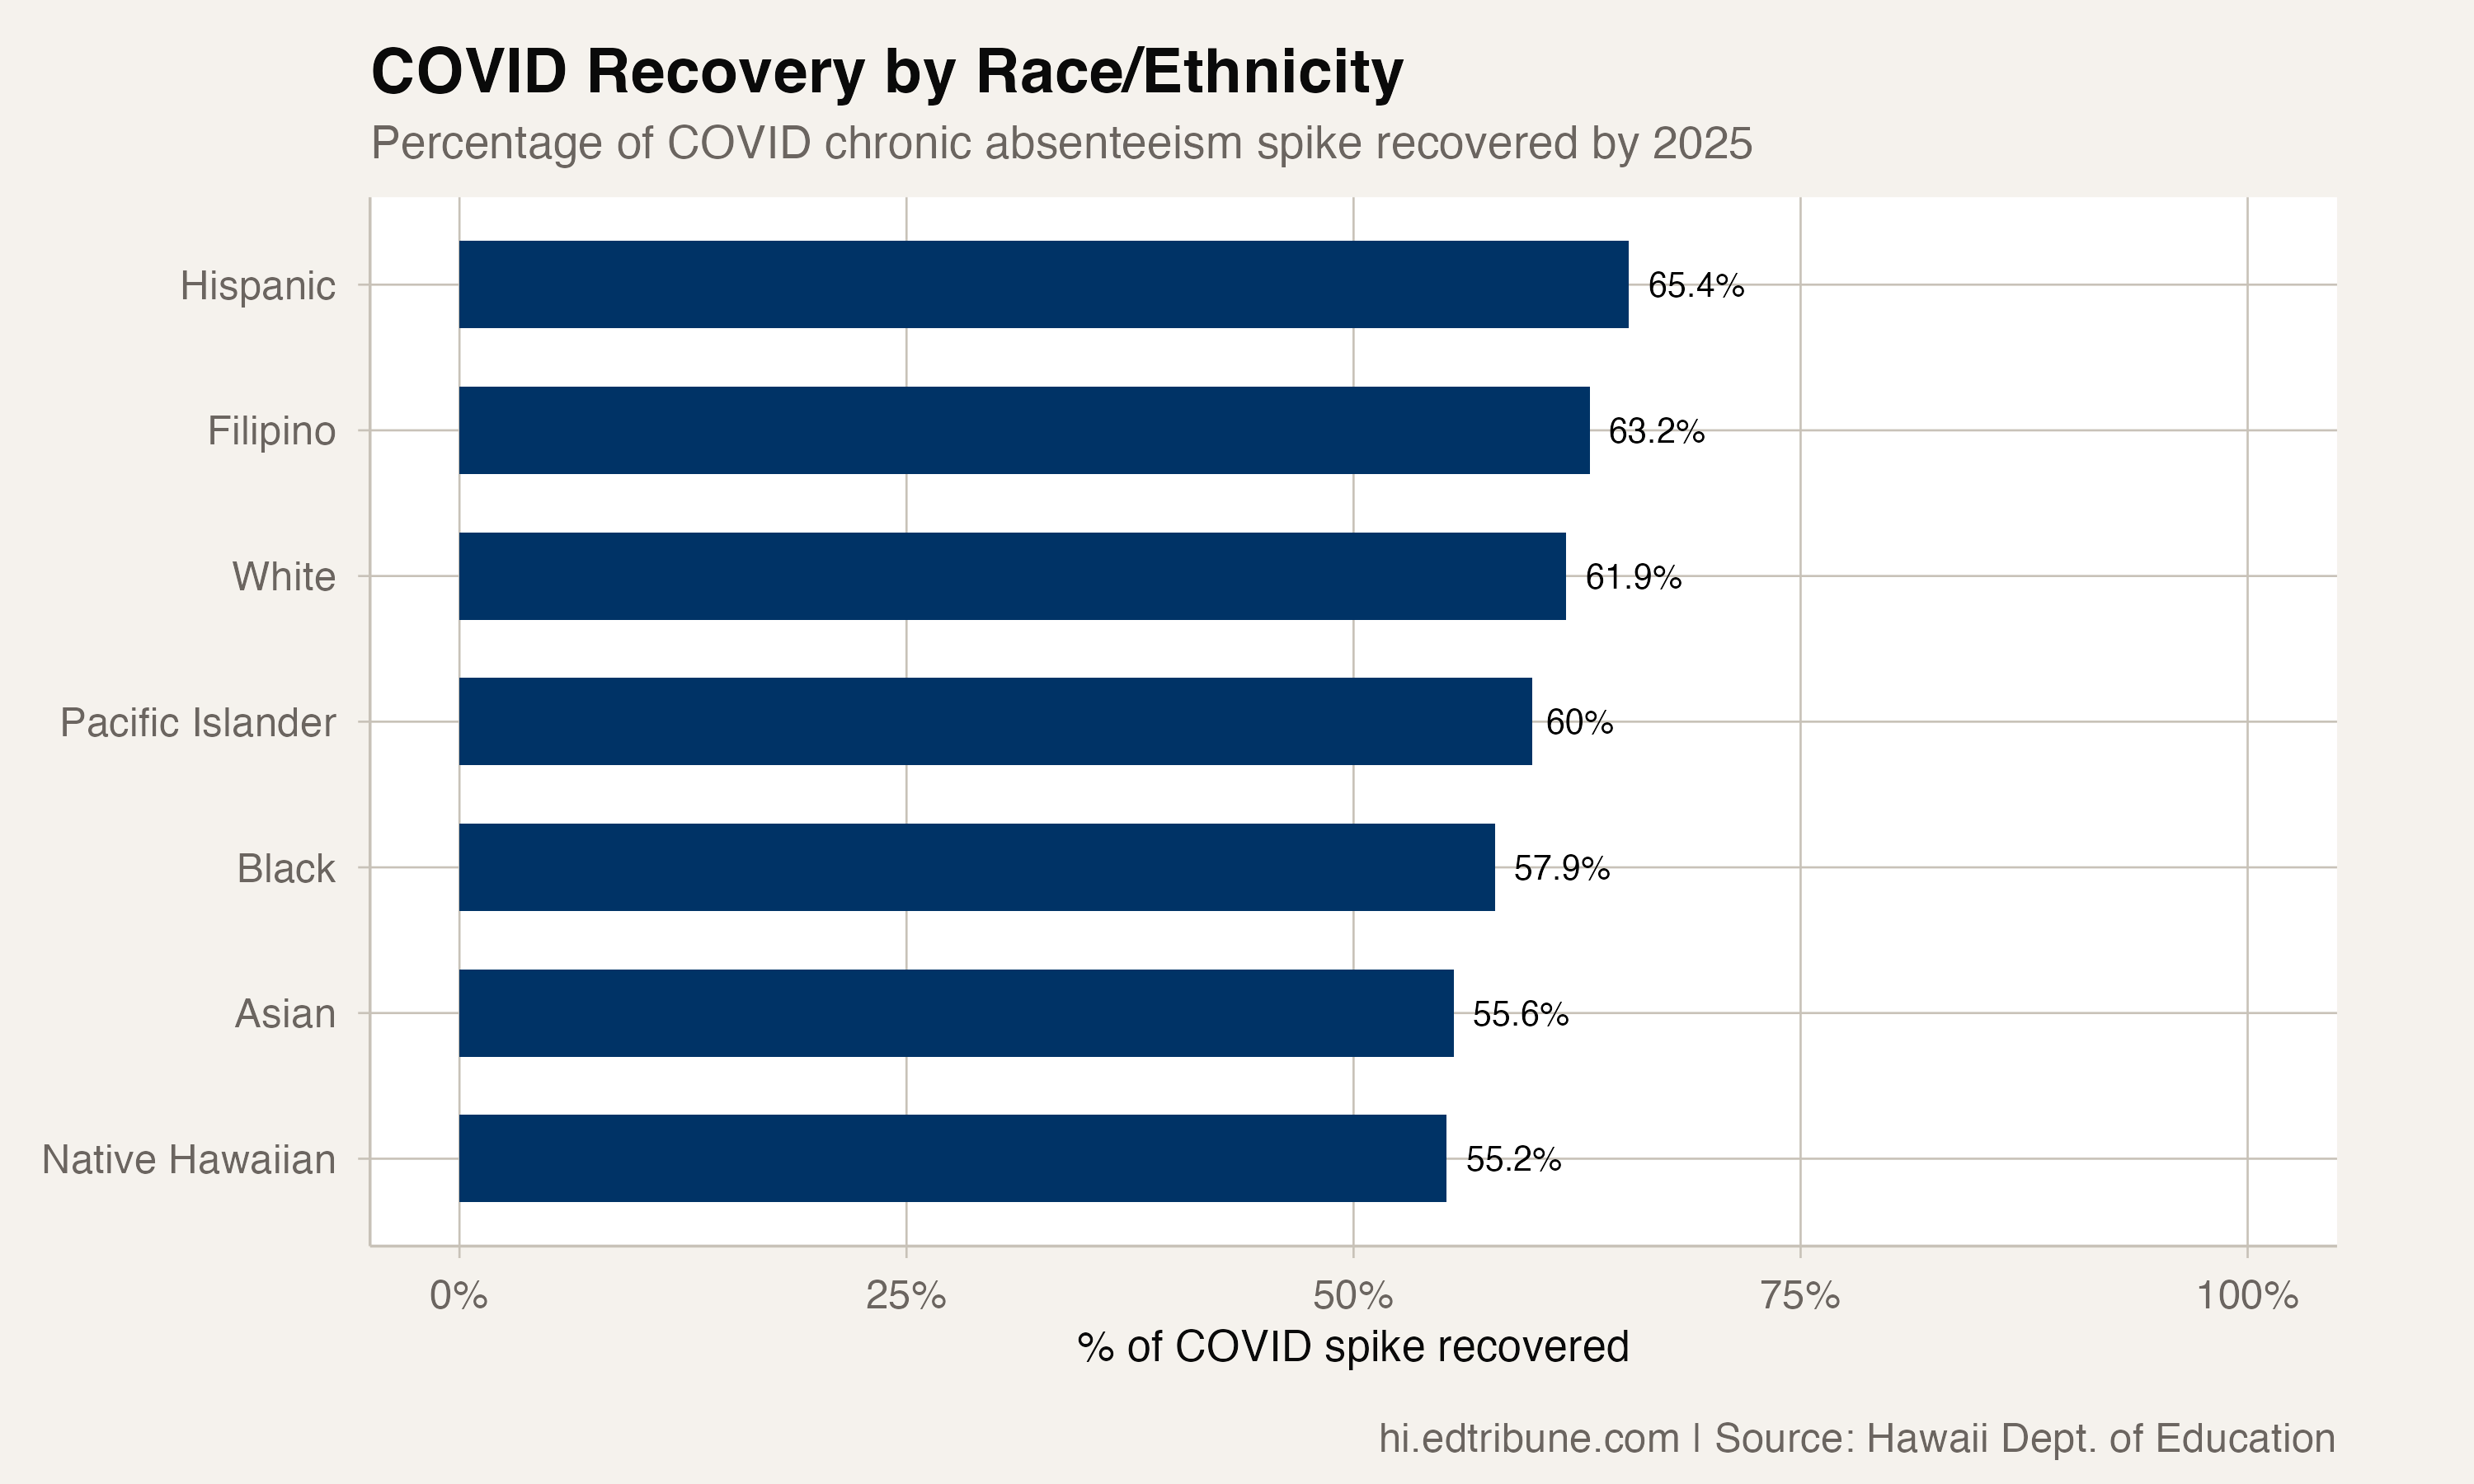
Correction (September 30, 2026): An earlier version compared Pacific Islander students' 2024-25 chronic absence rate with their rates in 2018-19 and 2021-22, said they had recovered 60% of their pandemic rise, and said their gap with Asian students had grown from 19 to 29 points. Hawaii changed how it counts chronic absence in 2023-24, from students absent 15 or more days to students absent 18 or more days, so those comparisons mixed two measures and have been removed. The earlier version also said four of seven racial groups were above the state average; three were.
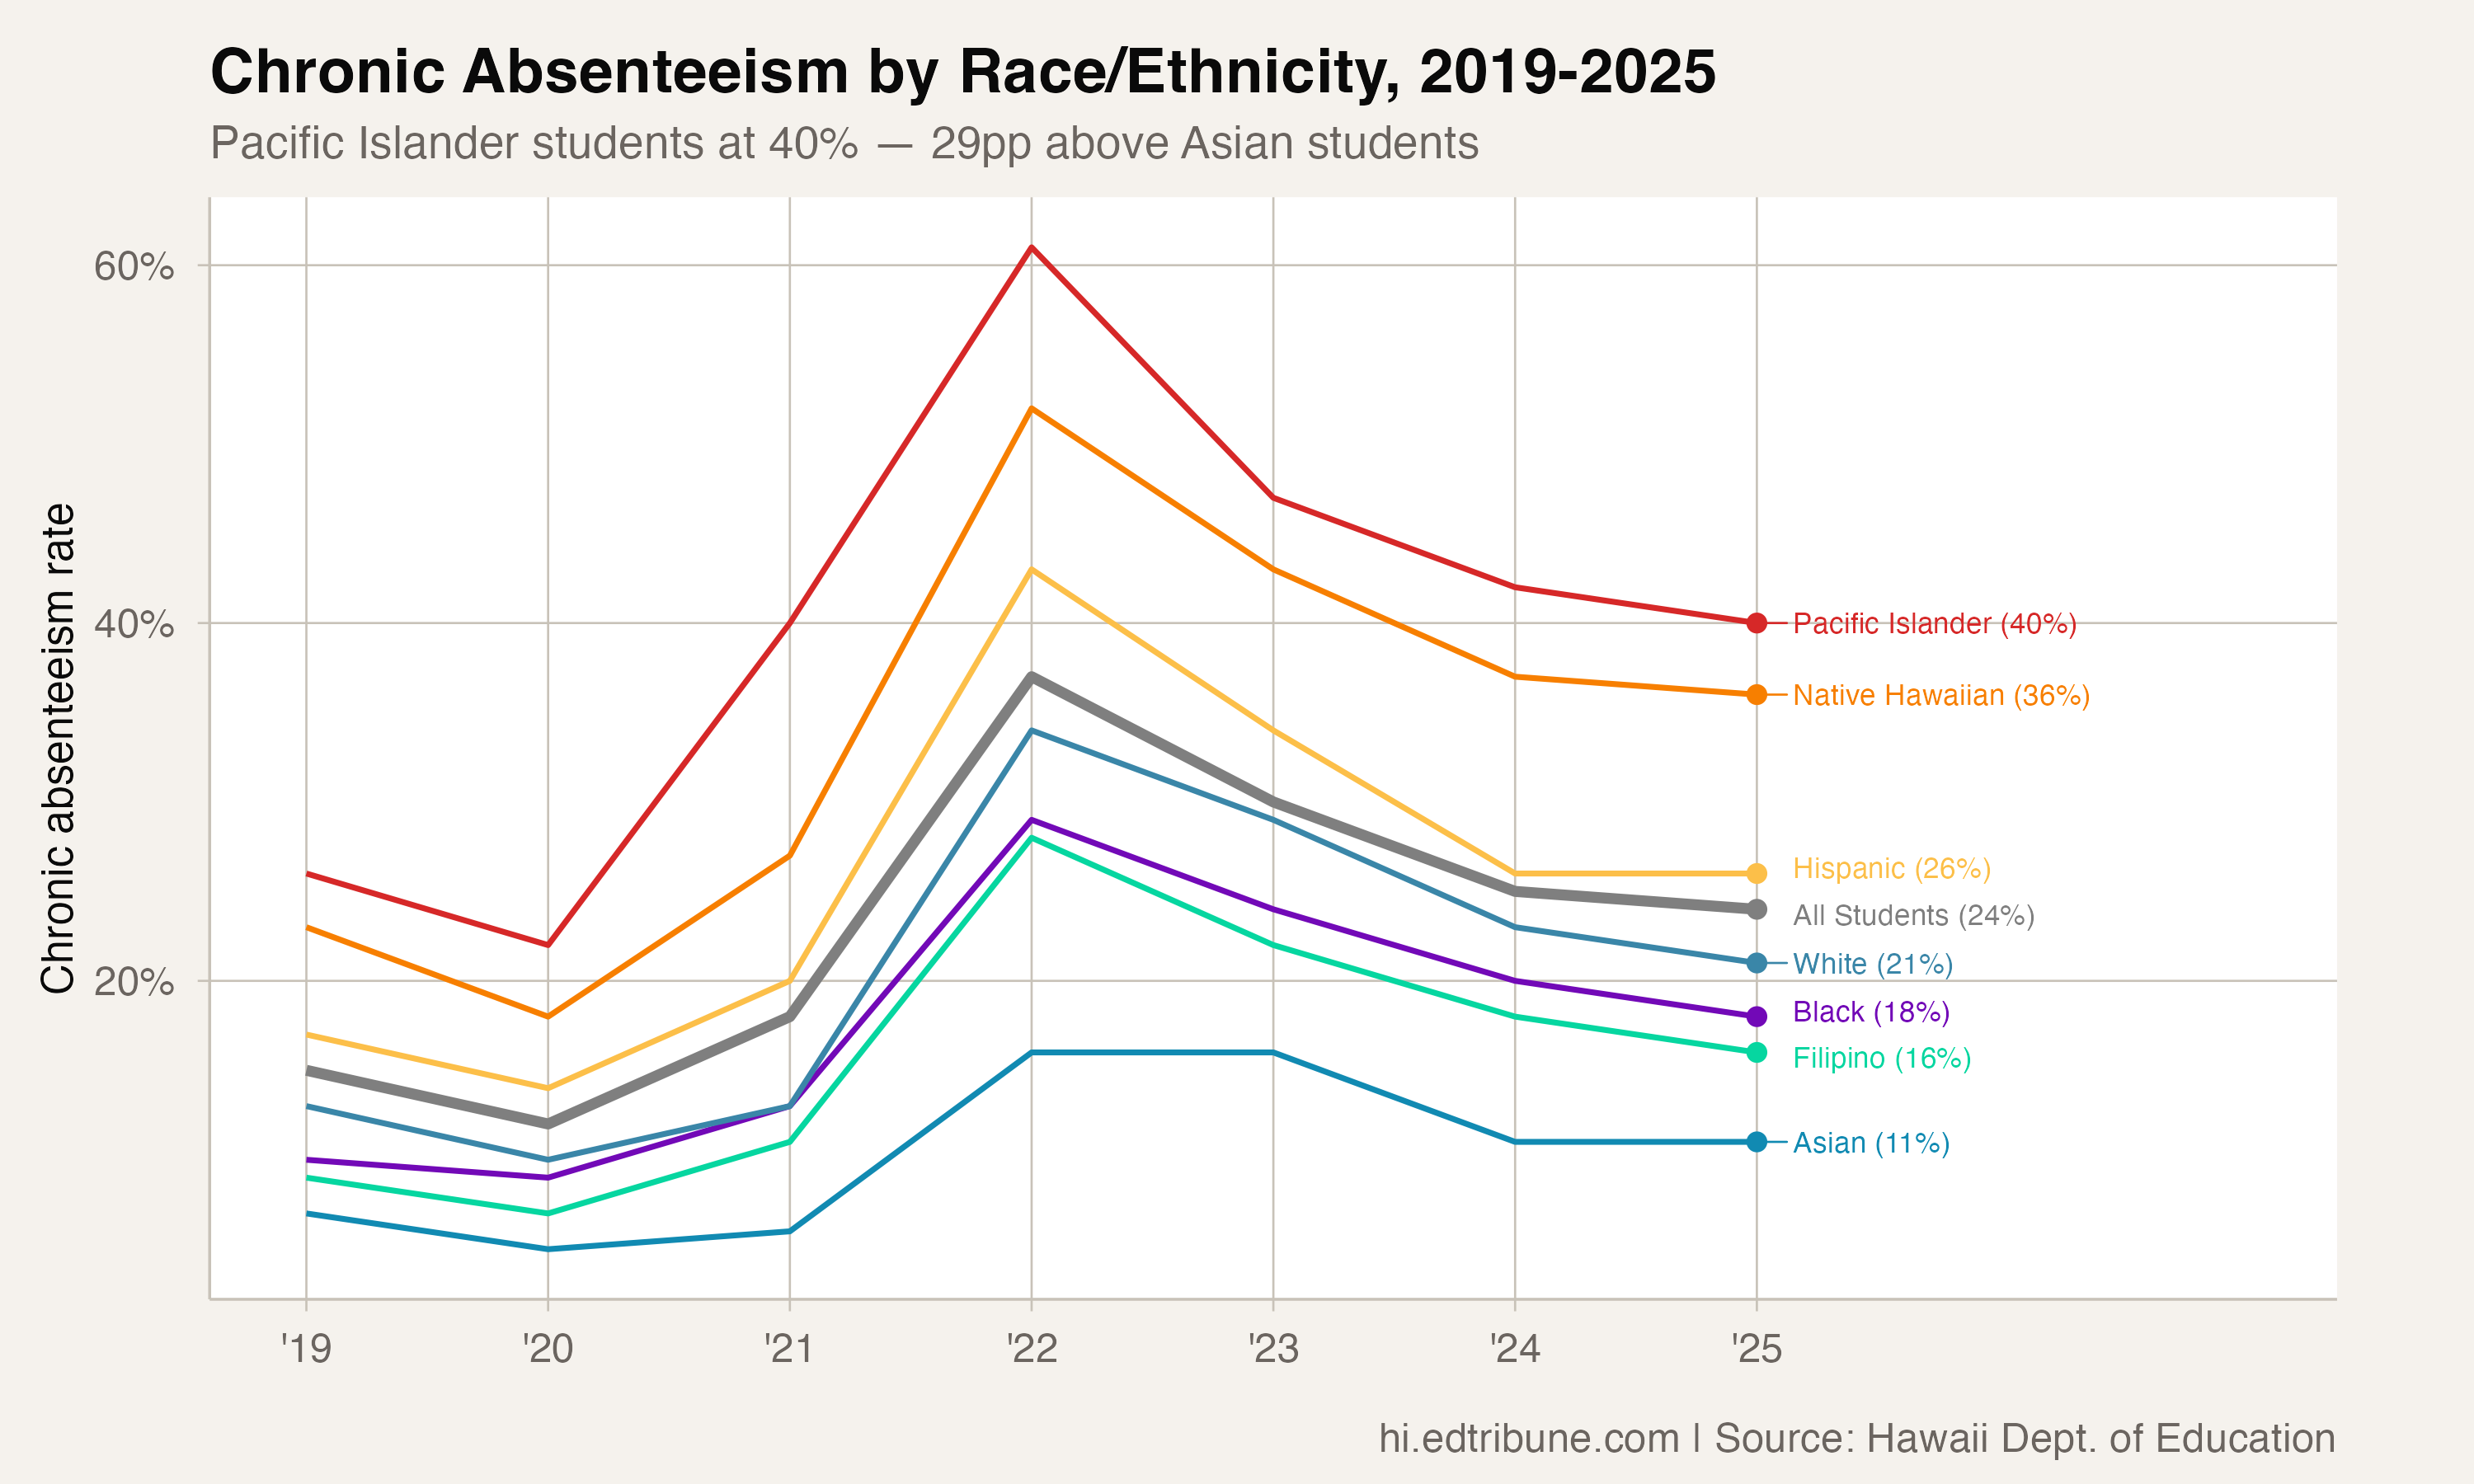
In 2024-25, 40% of Pacific Islander students in Hawaii were chronically absent, meaning they missed 18 or more days of school. That is two in five students, and the highest rate of any racial or ethnic group in the state.
It has been the highest rate every year. In each of the seven years of the state's published data, from 2018-19 through 2024-25, Pacific Islander students had the highest chronic absence rate and Asian students the lowest. Because those rankings compare groups within the same year, they hold on either side of the state's 2023-24 change in how it counts chronic absence.
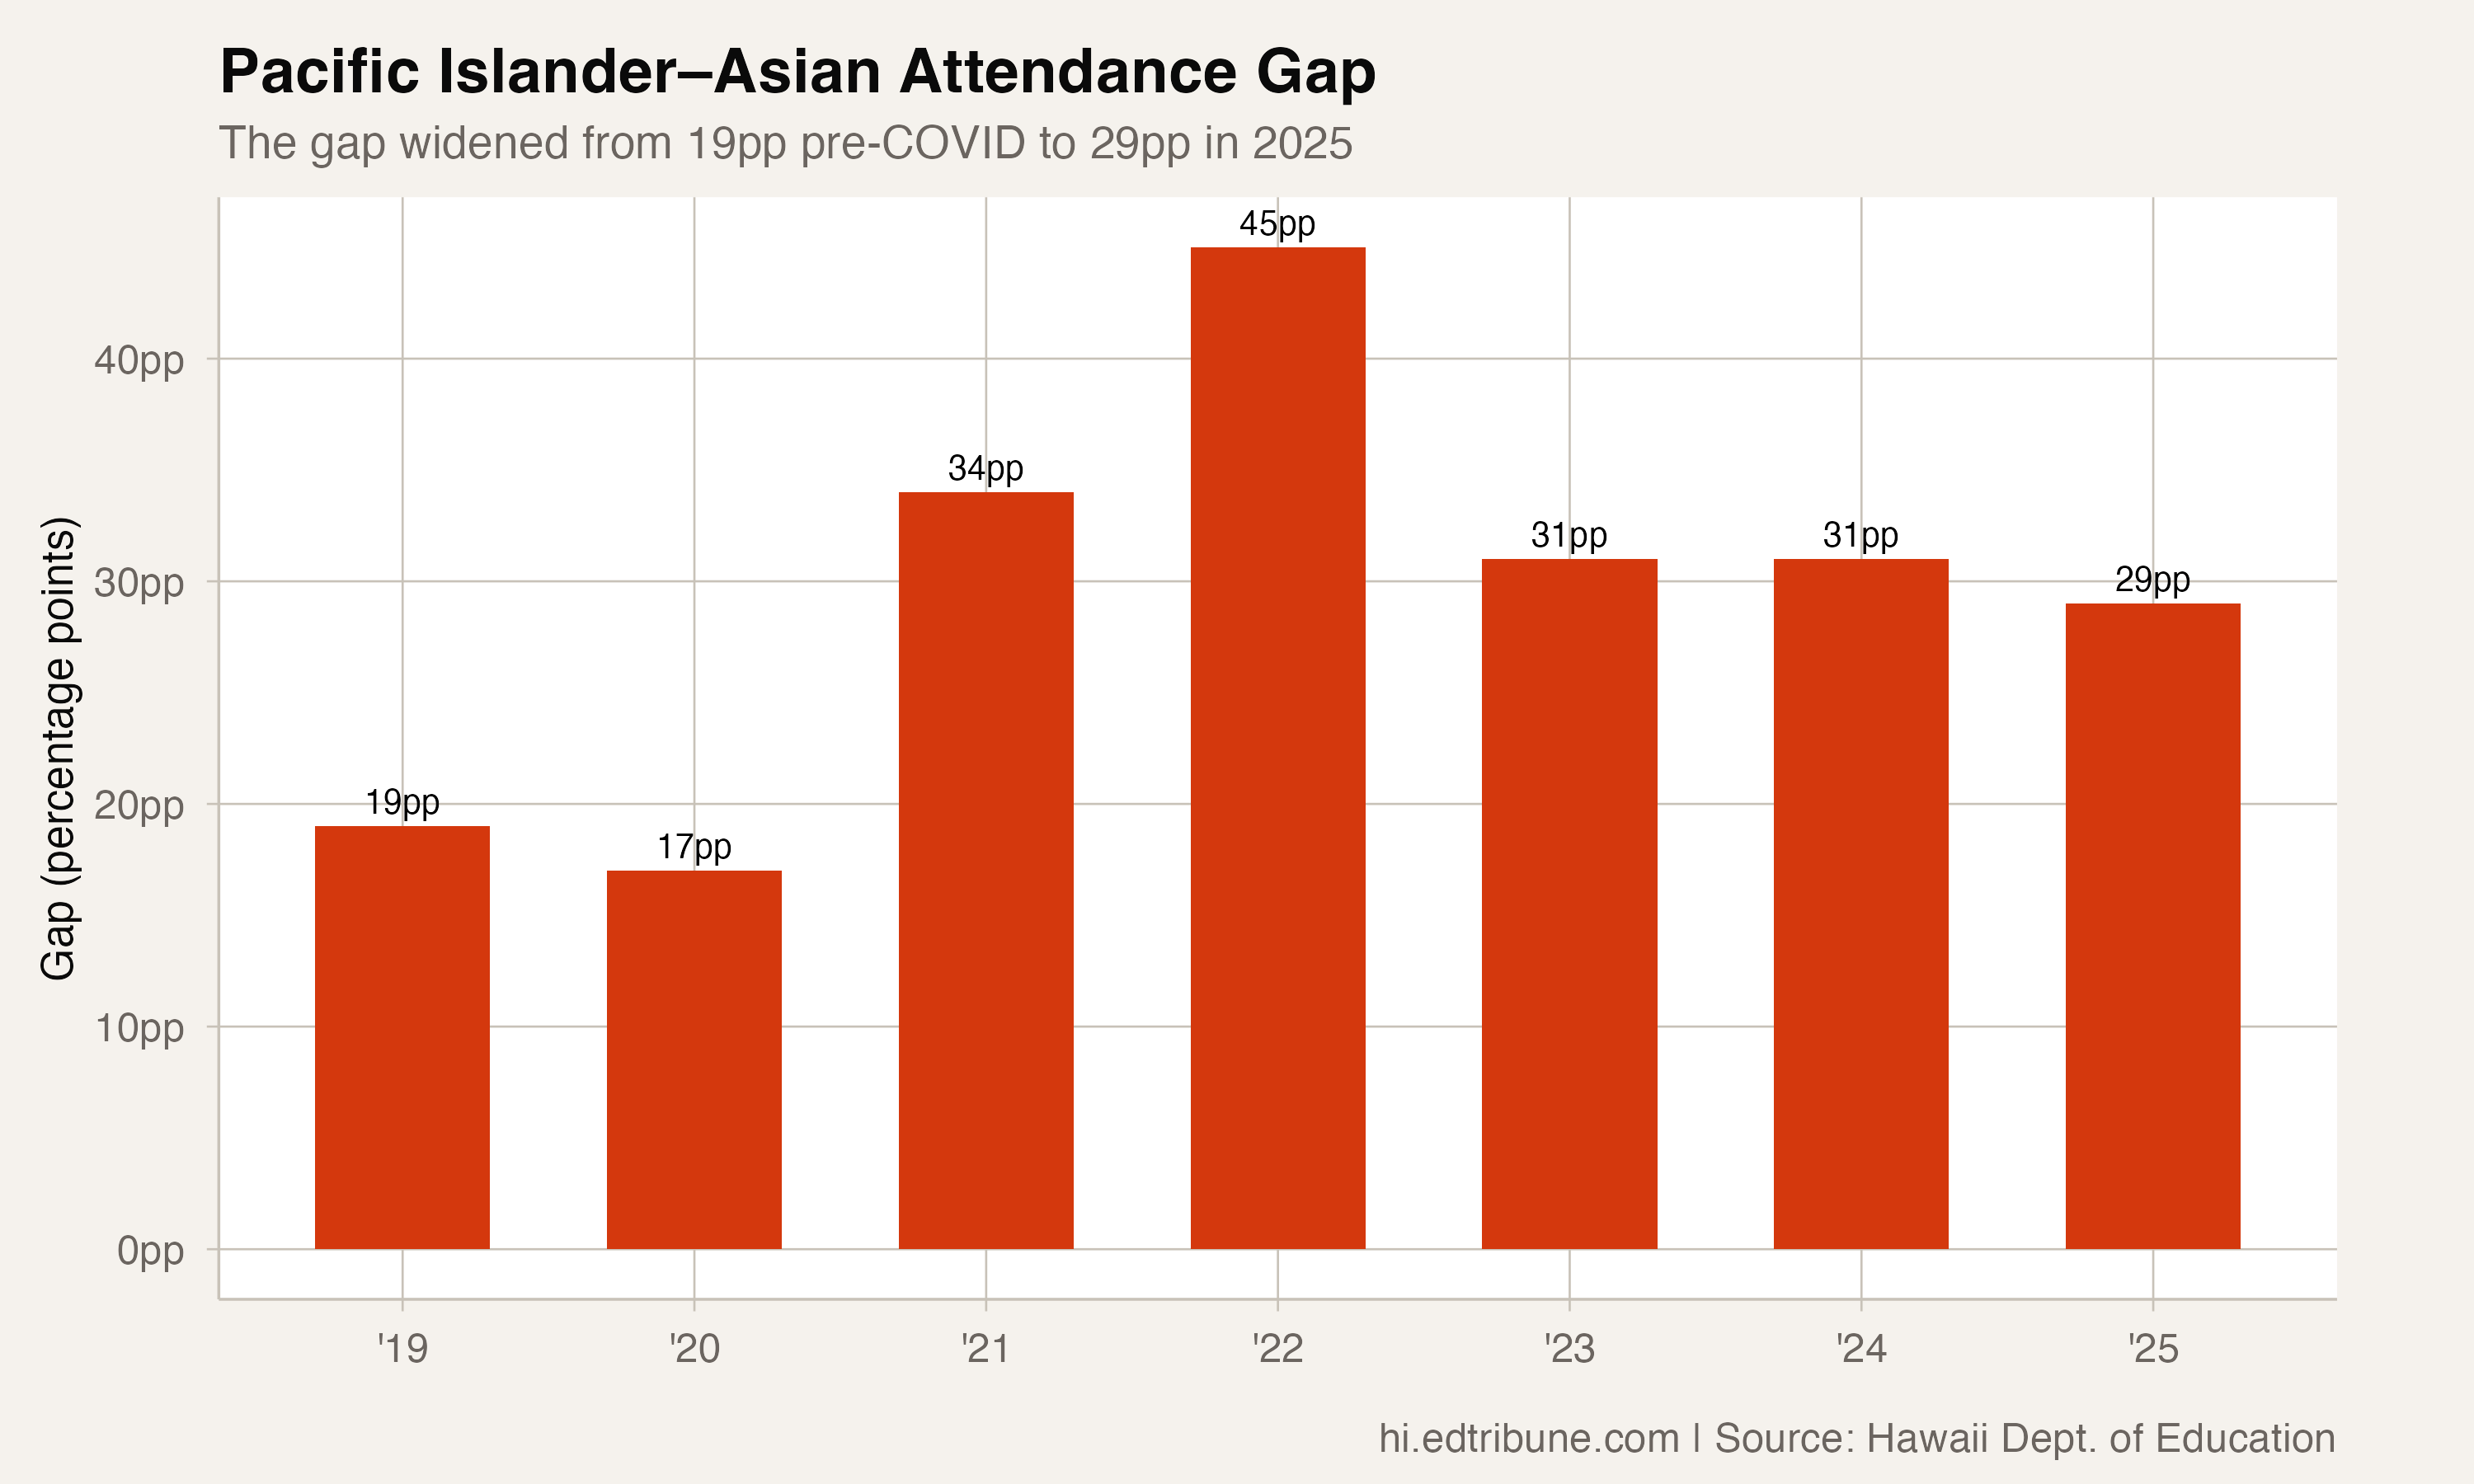
In 2024-25, the gap between Pacific Islander and Asian students was 29 percentage points, the largest between any racial group and Asian students. The Native Hawaiian-Asian gap was 25 points. For comparison, students eligible for free or reduced-price lunch were 8 points above the all-student rate, and students receiving special education services were 9 points above it.
The Gap, Measure by Measure
Under the older measure, which counted students absent 15 or more days, the gap between Pacific Islander and Asian students grew from 19 points in 2018-19 to 31 points in 2022-23. The Pacific Islander rate peaked at 61% in 2021-22, the highest of any group that year, and fell 14 points to 47% in 2022-23.
Under the newer measure, the gap narrowed from 31 points in 2023-24 to 29 points in 2024-25, as the Pacific Islander rate fell 2 points, from 42% to 40%, and the Asian rate held steady.
The older and newer figures cannot be joined into one trend: rates from 2023-24 on run lower partly because a student has to miss more days to be counted.
The 2024-25 Snapshot
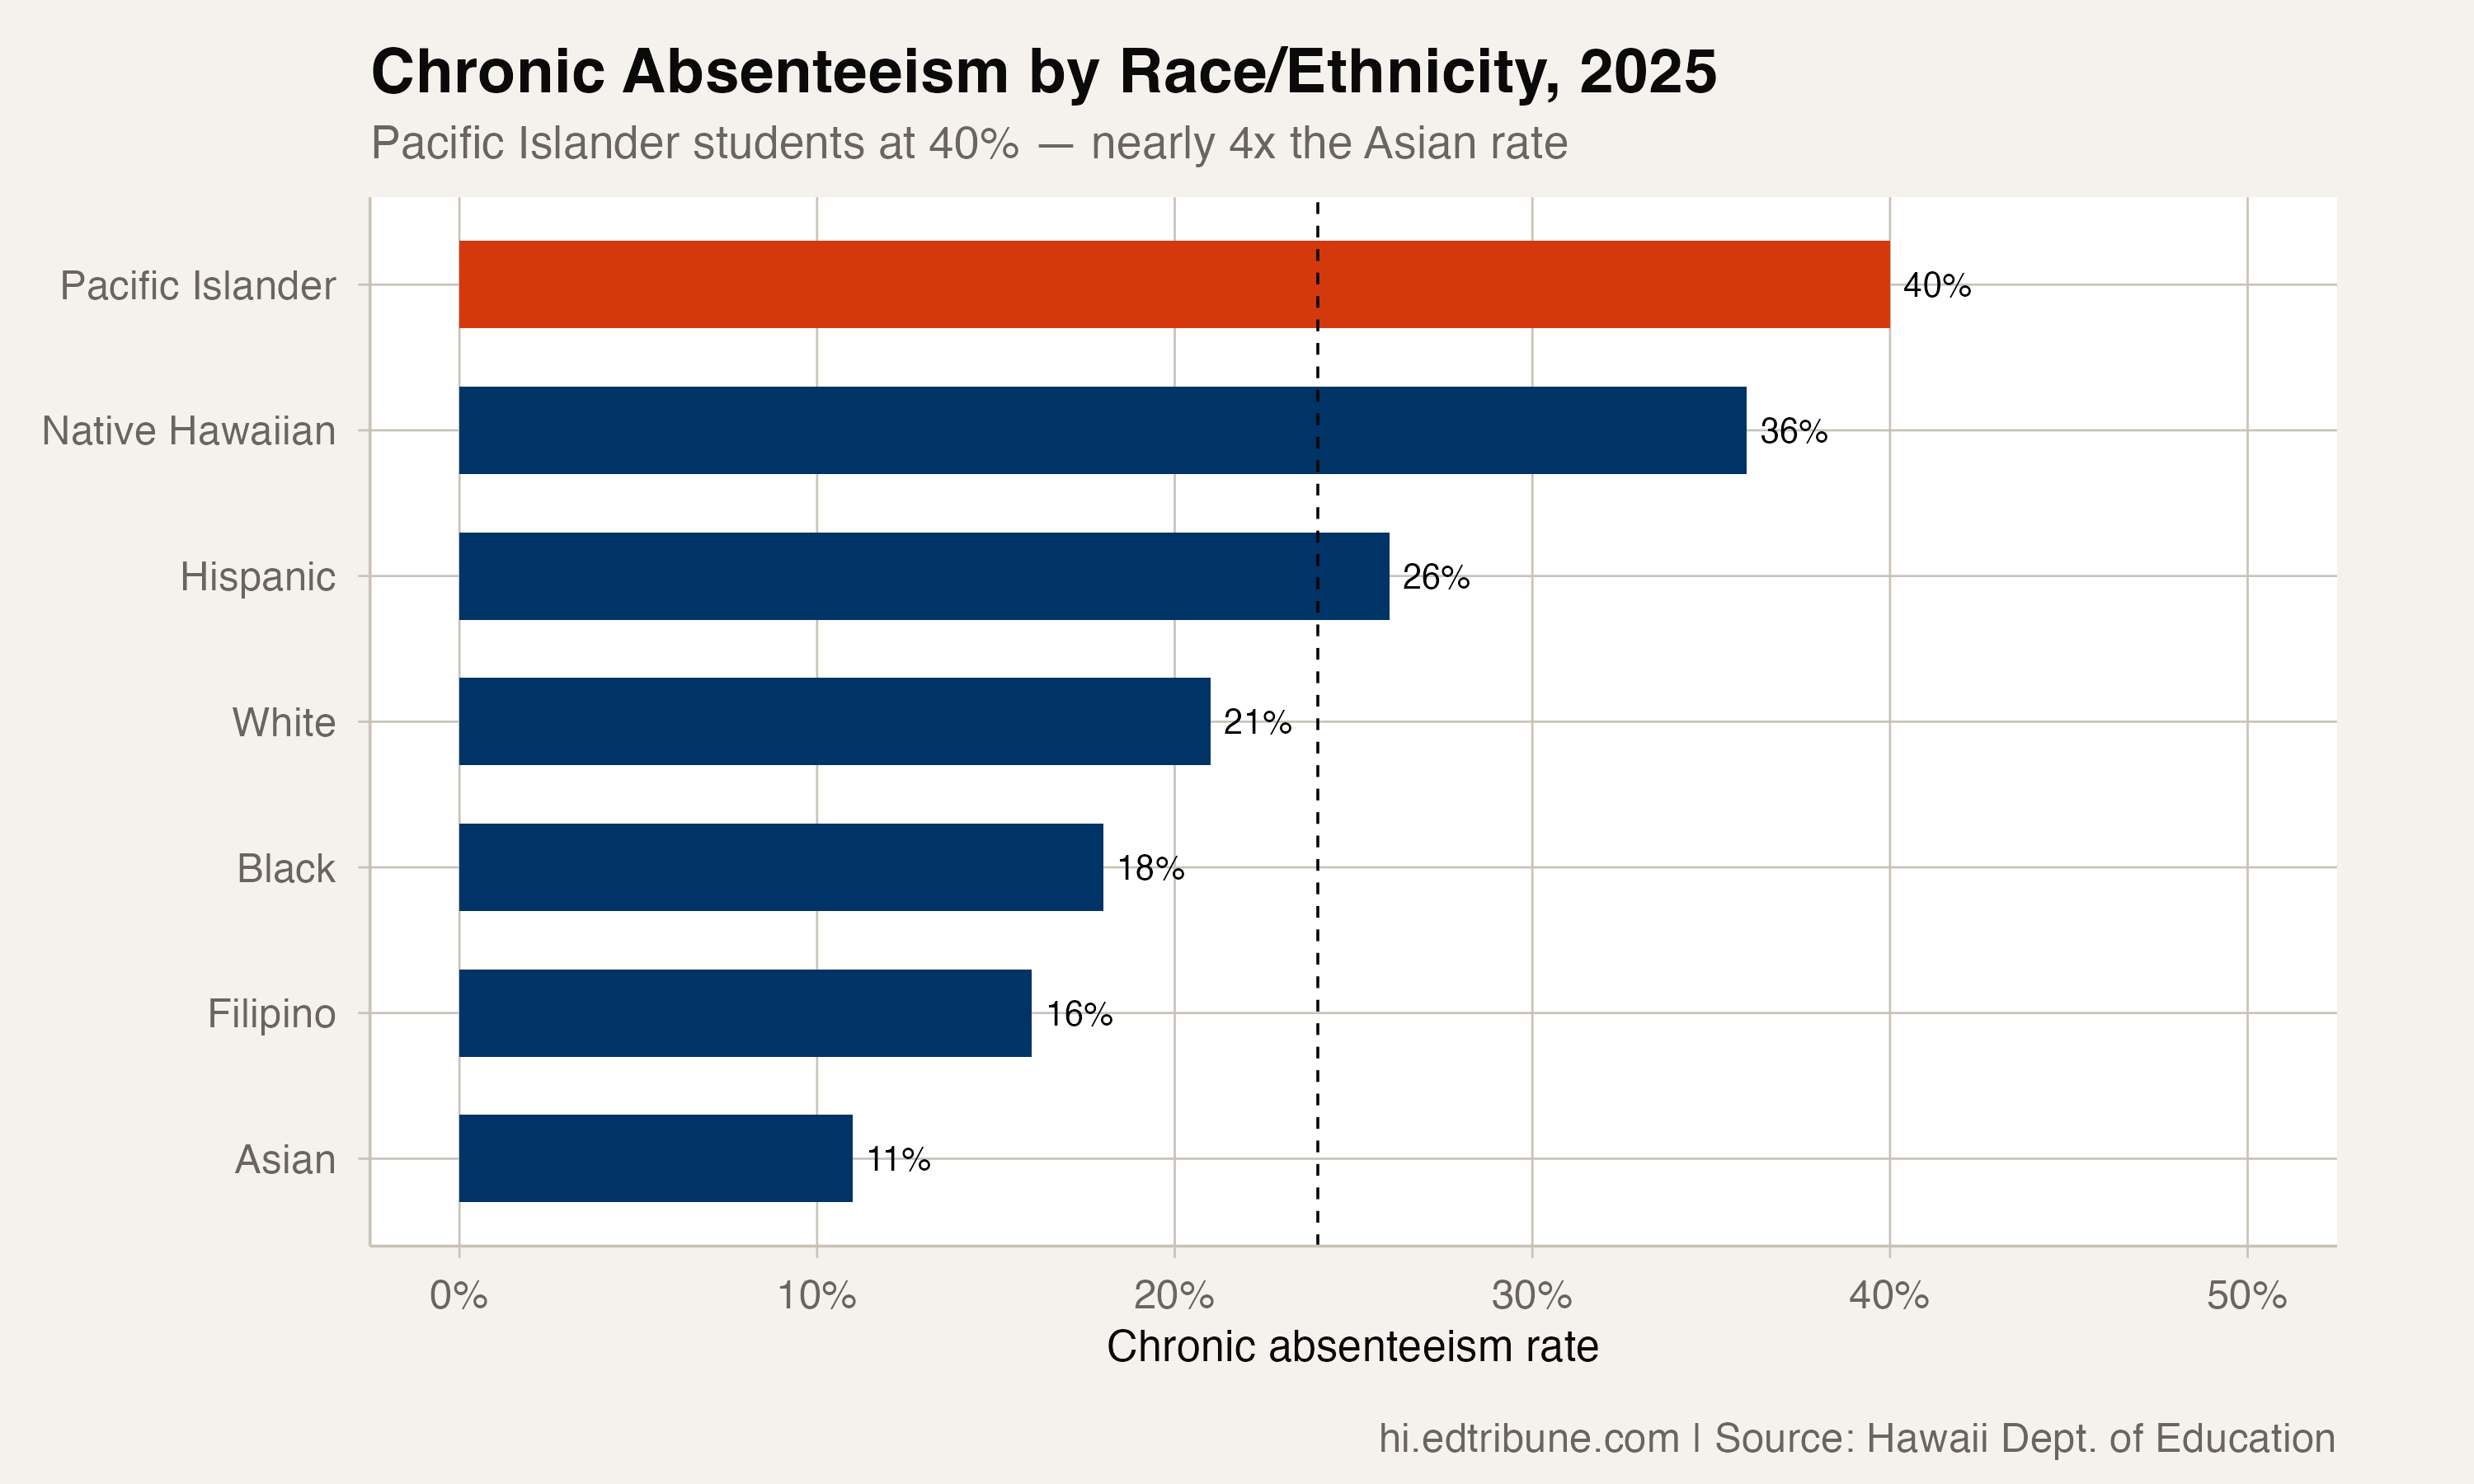
In 2024-25, the chronic absence rates by race and ethnicity were:
| Group | Rate | Gap vs. State Rate |
|---|---|---|
| Pacific Islander | 40% | +16pp |
| Native Hawaiian | 36% | +12pp |
| Hispanic | 26% | +2pp |
| White | 21% | -3pp |
| Black | 18% | -6pp |
| Filipino | 16% | -8pp |
| Asian | 11% | -13pp |
The statewide rate was 24%. Three of the seven groups were above it. The only change in the order across the seven years came in 2020-21, when Black and White students were tied at 13%.
One Year on the New Measure
Between 2023-24 and 2024-25, five of the seven groups improved, and none rose. Pacific Islander, White, Black, and Filipino students each fell 2 points.
Why the Gap Persists
The state's attendance files record rates by group, not the housing, health, transportation, or work circumstances behind them, so they cannot say why the gap has persisted through every year of the data.
Hawaii reports Pacific Islander as a distinct category in its education data, a level of detail many states do not provide. Where Pacific Islander students are folded into a combined "Native Hawaiian/Pacific Islander" category, or into "Asian," a 29-point attendance gap like this one would disappear into the average. In Hawaii, the data exist. The open question is what the state does with them.
Attendance figures come from the Hawaii Department of Education's school accountability reports, covering 2018-19 through 2024-25.
Detailed code that reproduces the analysis and figures in this article is available exclusively to EdTribune subscribers.
Discussion
Sign in to join the discussion.
Loading comments...