Correction (September 30, 2026): An earlier version compared Native Hawaiian students' 2024-25 chronic absence rate with their rates in 2018-19 and 2021-22, said the gap with Asian students was 9 points wider than before the pandemic, and ranked groups by how much of their pandemic rise they had recovered. Hawaii changed how it counts chronic absence in 2023-24, from students absent 15 or more days to students absent 18 or more days, so those comparisons mixed two measures and have been removed. The earlier version also said 36% of Native Hawaiian students miss 15 or more days; the 2024-25 figure counts students absent 18 or more days. The article's main finding, a comparison within each school in a single year, is unchanged.
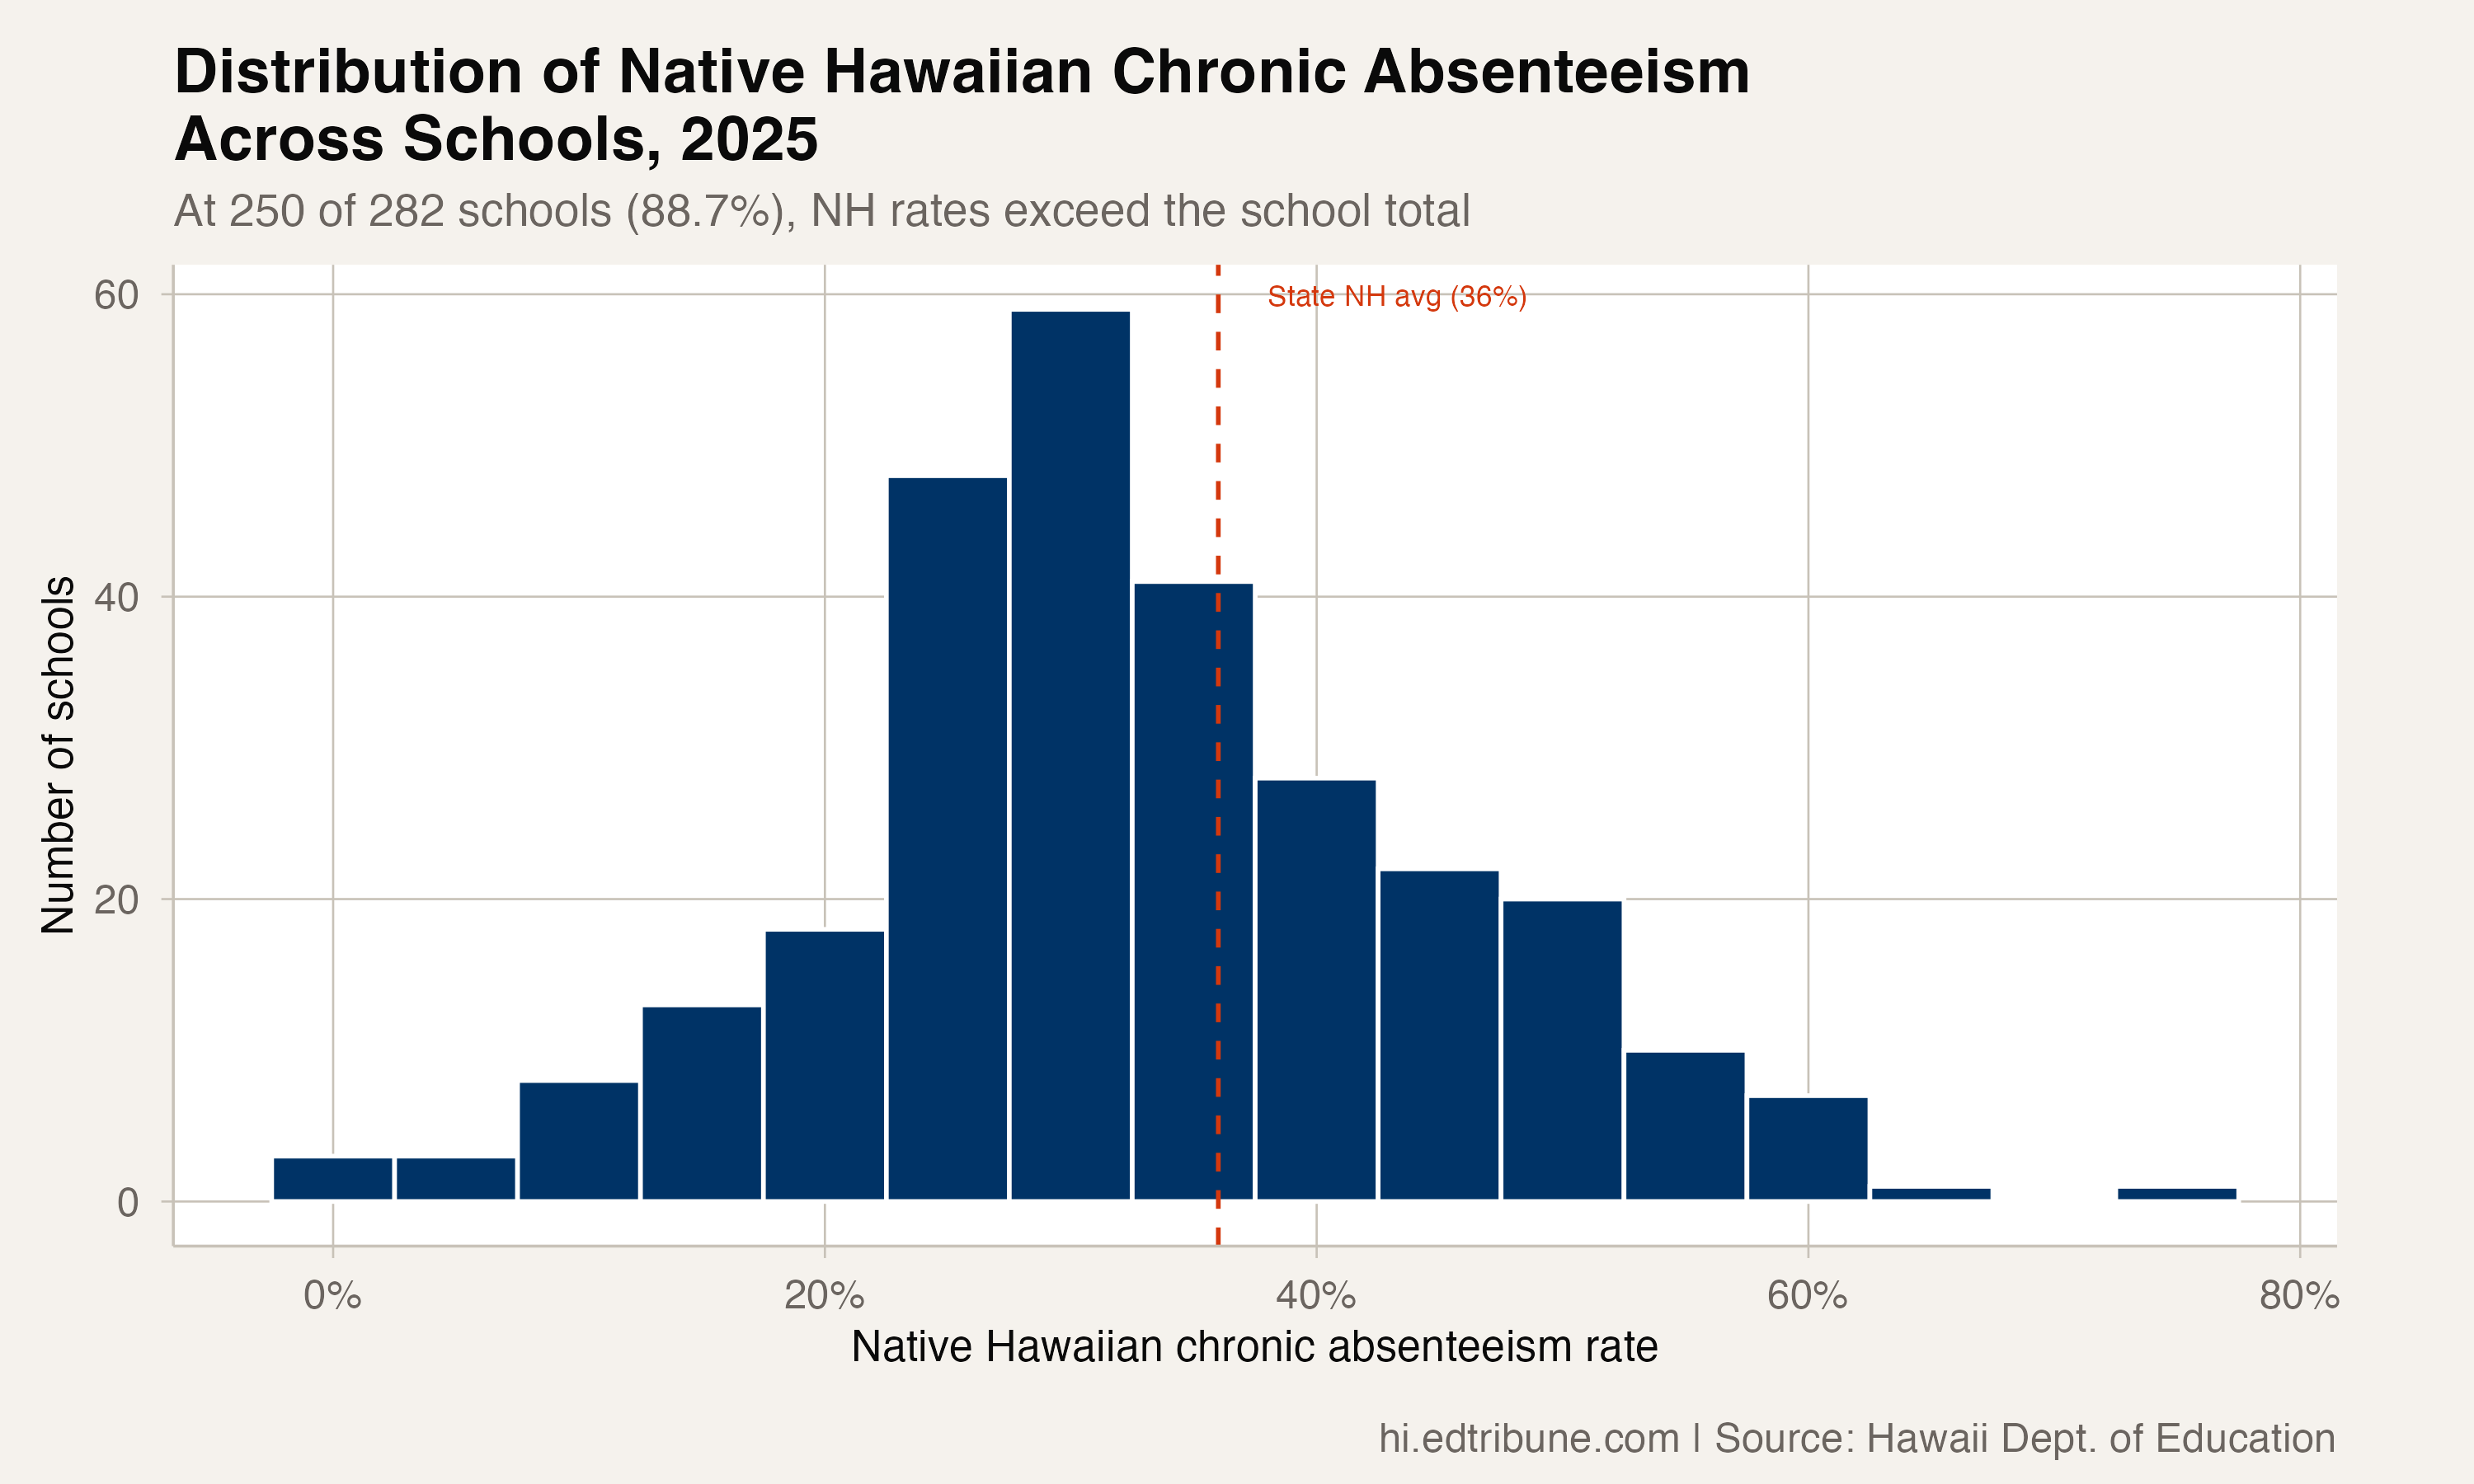
At 250 of the 282 Hawaii schools that reported both rates in 2024-25, Native Hawaiian students were chronically absent at a higher rate than the school's student body as a whole. That is 88.7% of schools.
It is not a one-year result. The share was 88.3% in 2023-24, at 248 of 281 schools, and 86.5% in 2022-23. Because each figure compares students in the same school in the same year, it holds on either side of the state's 2023-24 change in how it counts chronic absence.
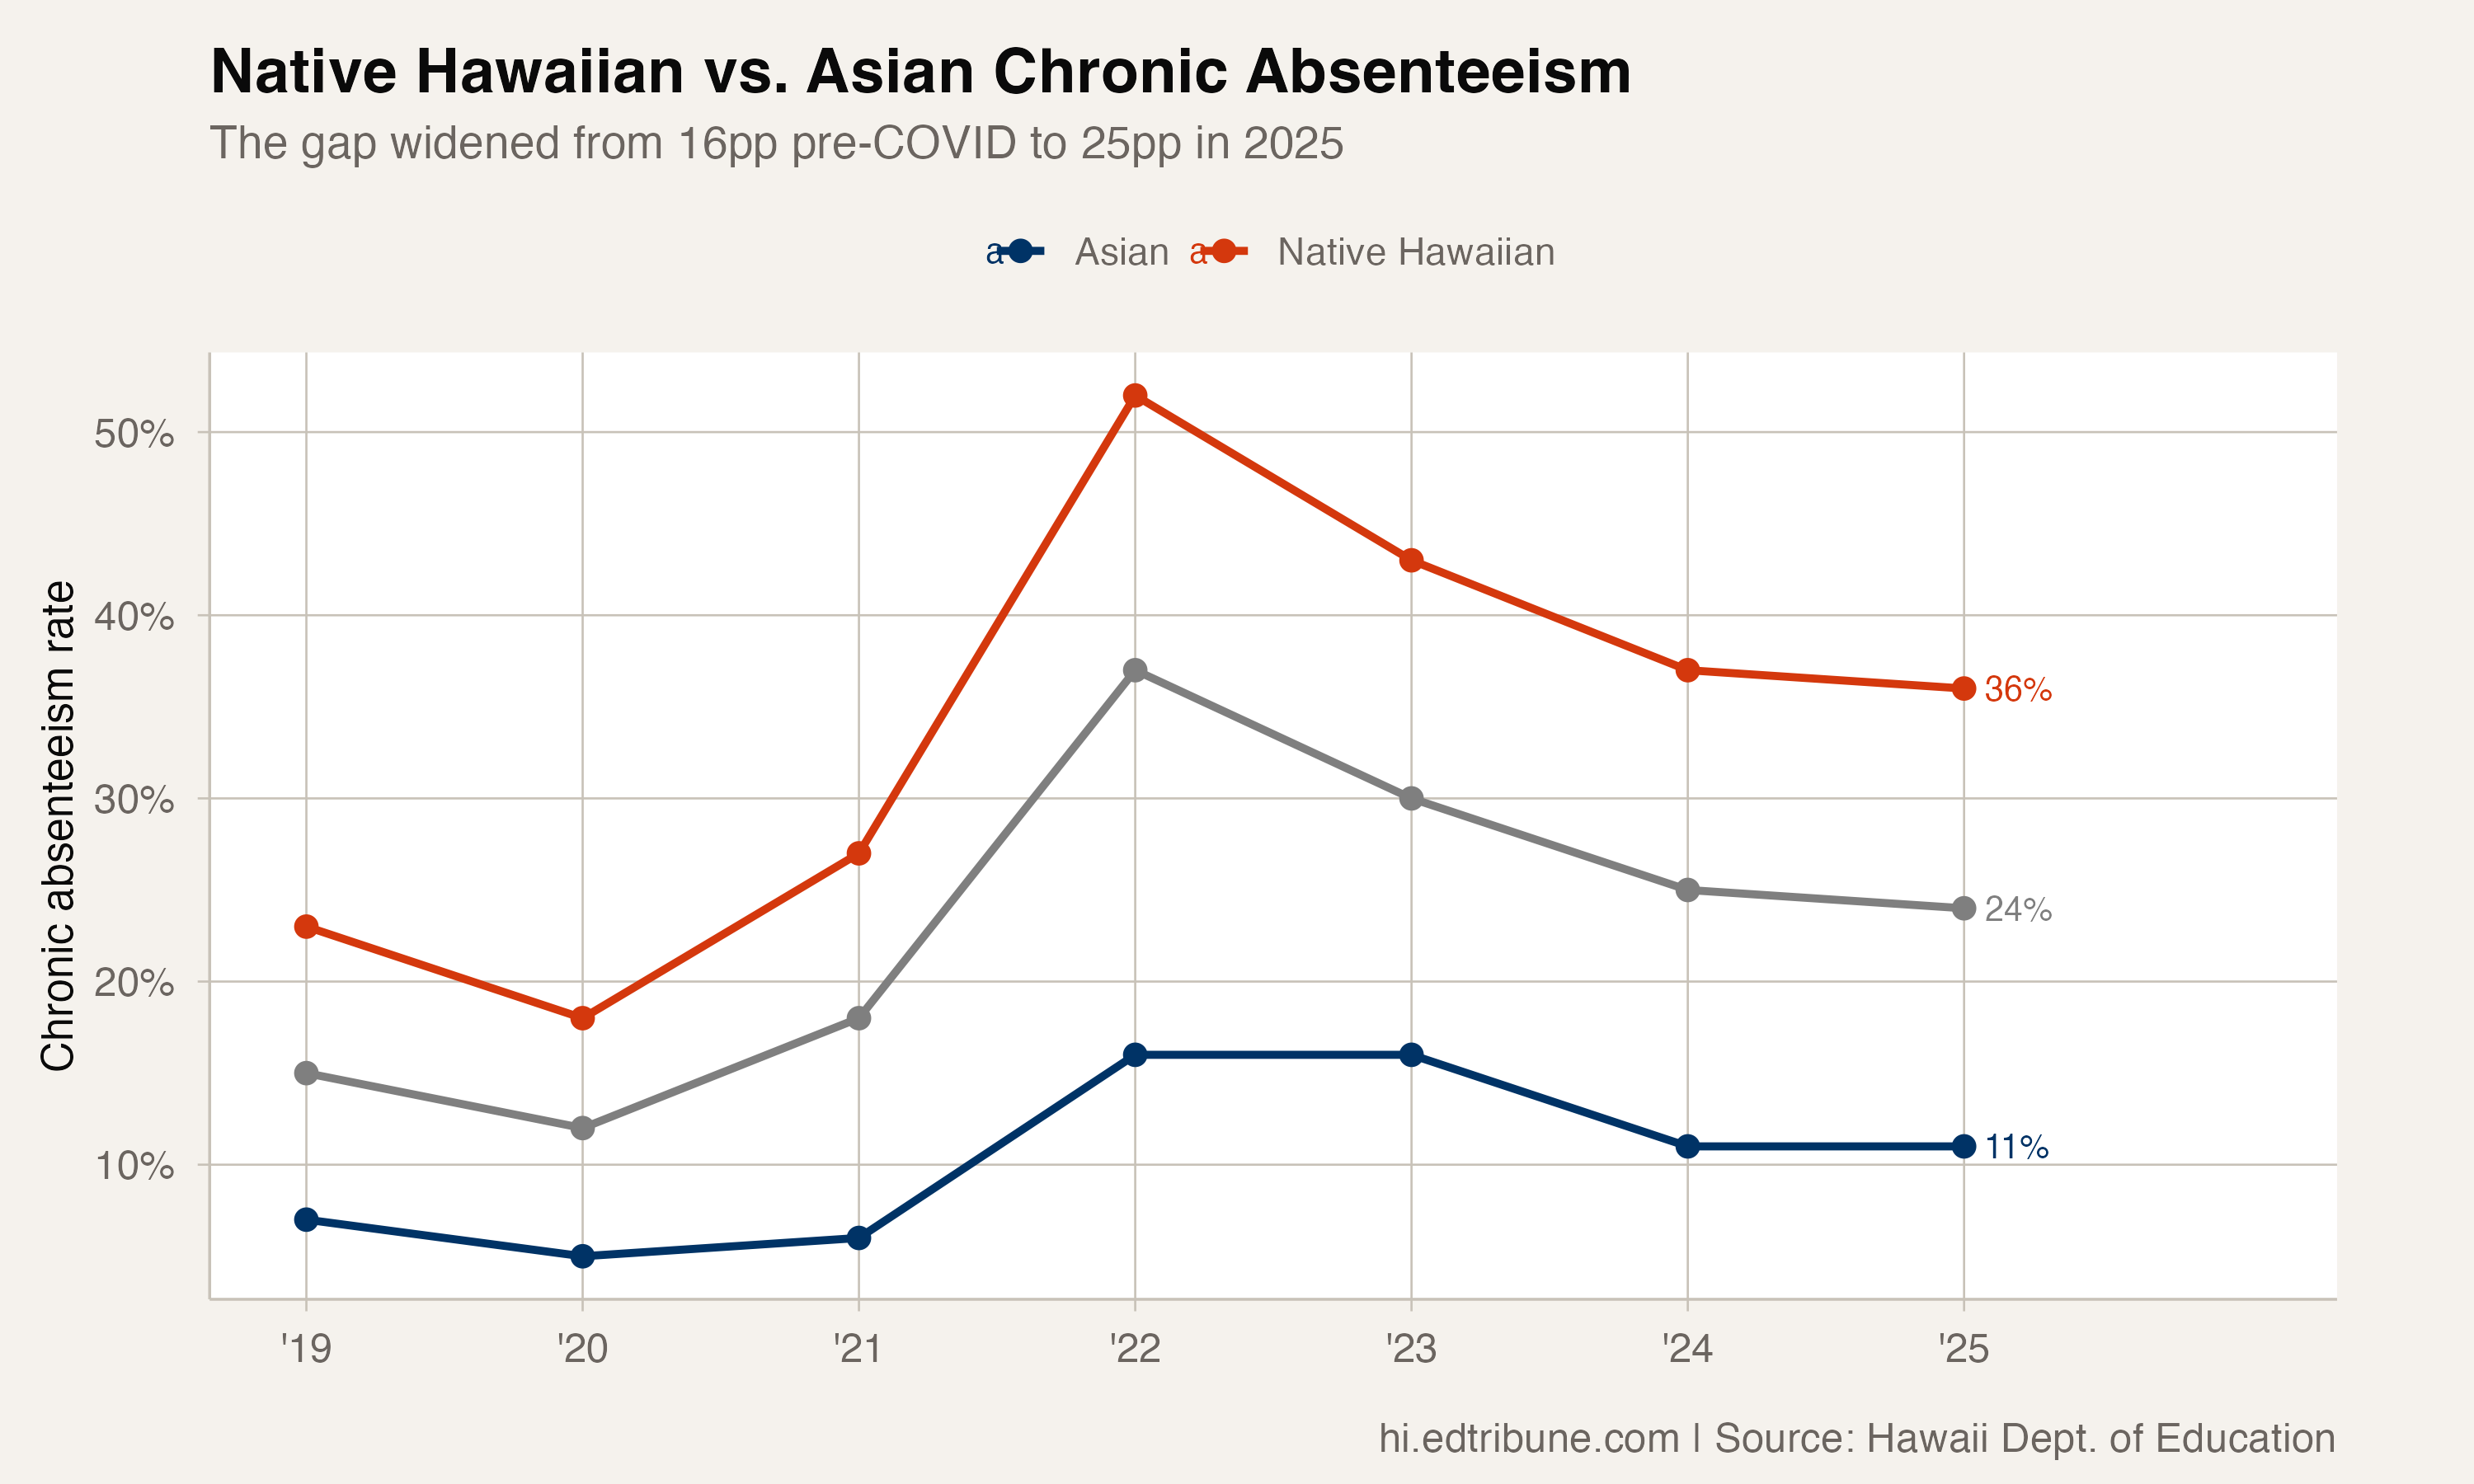
Statewide, 36% of Native Hawaiian students were chronically absent in 2024-25, meaning they missed 18 or more days of school. That is 12 percentage points above the rate for all students, 24%, and more than three times the rate for Asian students, 11%.
The Gap, Measured Two Ways
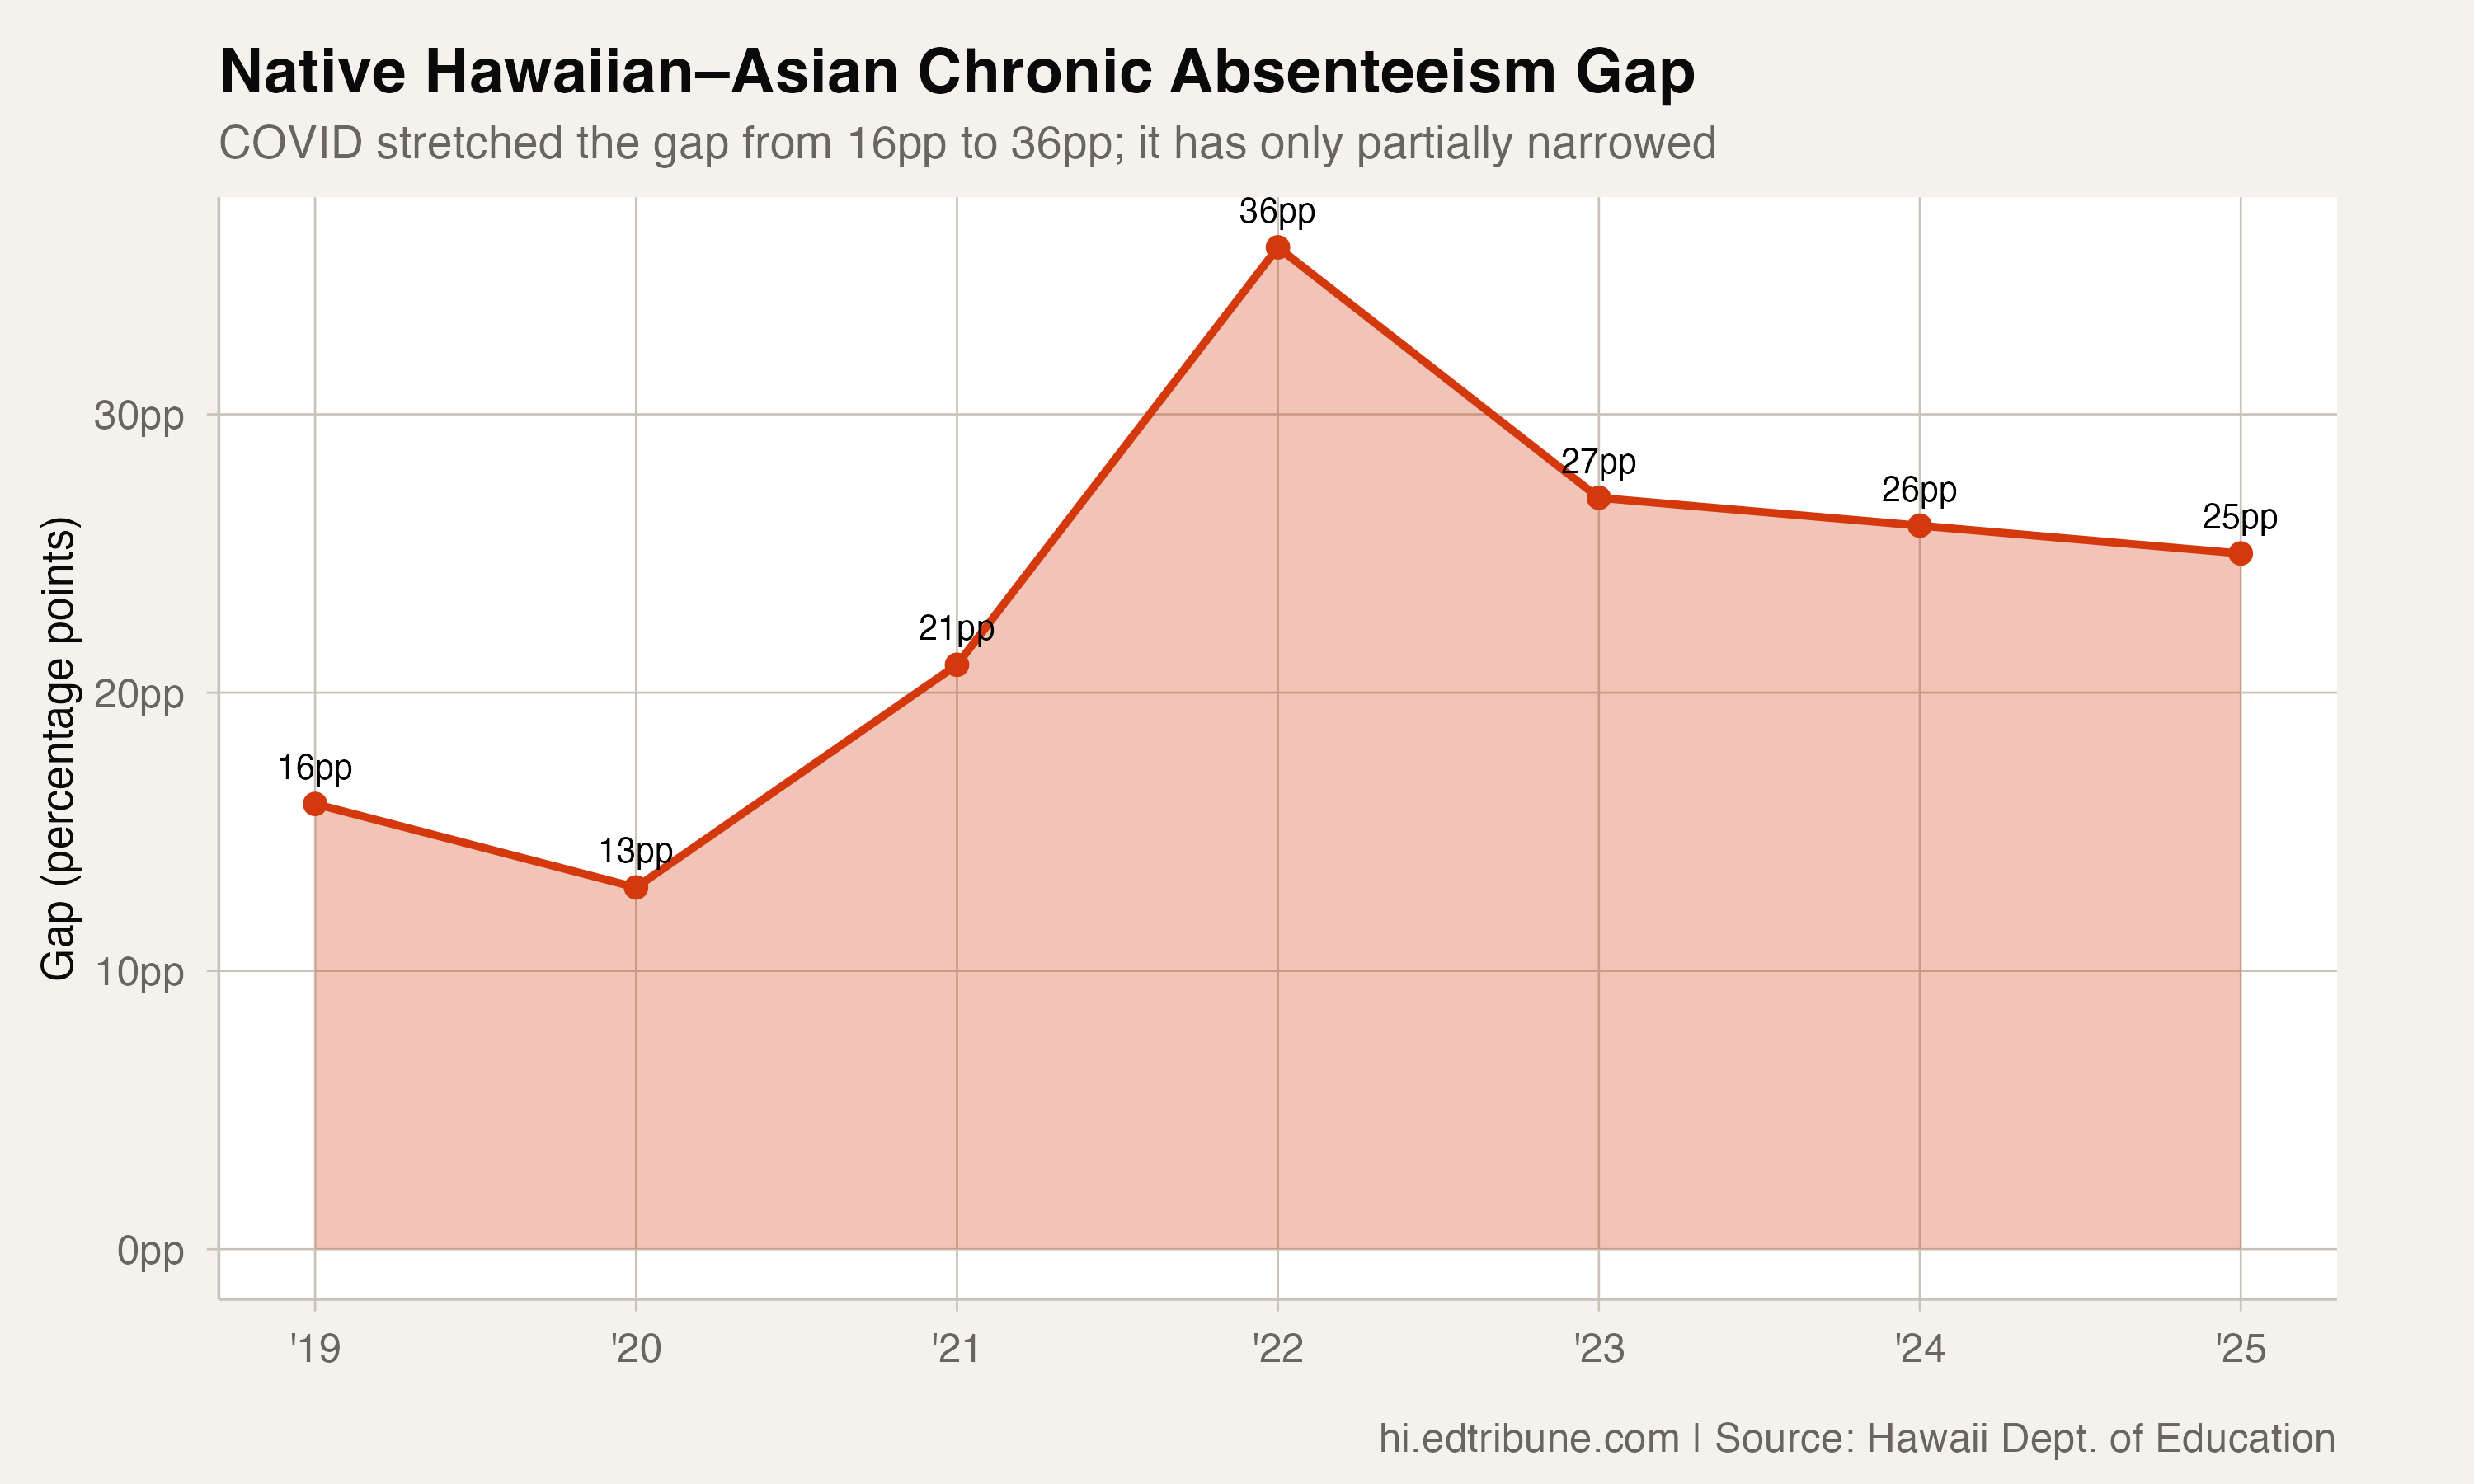
Under the older measure, which counted students absent 15 or more days, the gap between Native Hawaiian and Asian students grew from 16 percentage points in 2018-19 (23% against 7%) to 27 points in 2022-23 (43% against 16%). Native Hawaiian rates peaked at 52% in 2021-22.
Under the newer measure, the gap was 26 points in 2023-24 and 25 points in 2024-25. The Native Hawaiian rate fell 1 point, from 37% to 36%, while the Asian rate held at 11%.
The two sets of numbers cannot be joined into one trend. Rates from 2023-24 on run lower partly because a student has to miss more days to be counted.
Where the Rates Are Highest
At some schools, the Native Hawaiian rate far exceeds the school's overall rate. At Princess Victoria Ka'iulani Elementary in Honolulu, 64% of Native Hawaiian students were chronically absent in 2024-25, against 36% of the whole school. Kulanihako'i High School on Maui had a 62% Native Hawaiian rate against 45% overall. At Ho'okena Elementary on Hawaii Island, the two rates were closer: 60% for Native Hawaiian students and 57% for the school.
Across the State
Across all 282 schools, the median Native Hawaiian rate in 2024-25 was 31.5%, above the statewide rate for all students. At 58 schools, the Native Hawaiian rate was at or below that statewide 24%.
A Gap You Can Only See in Hawaii
Many national datasets never show this pattern. Federal race categories combine Native Hawaiian students with other Pacific Islanders, which would blend the 36% Native Hawaiian rate with the 40% Pacific Islander rate.
Hawaii reports Native Hawaiian students separately, and the school-by-school comparison shows why that matters: a gap that appears at the large majority of schools, year after year, is a statewide pattern rather than a problem of a few schools. The state's attendance files do not record the family, housing, health, or transportation circumstances behind it, so they cannot say what drives it.
Attendance figures come from the Hawaii Department of Education's school accountability reports, covering 2018-19 through 2024-25.
Detailed code that reproduces the analysis and figures in this article is available exclusively to EdTribune subscribers.
Discussion
Sign in to join the discussion.
Loading comments...