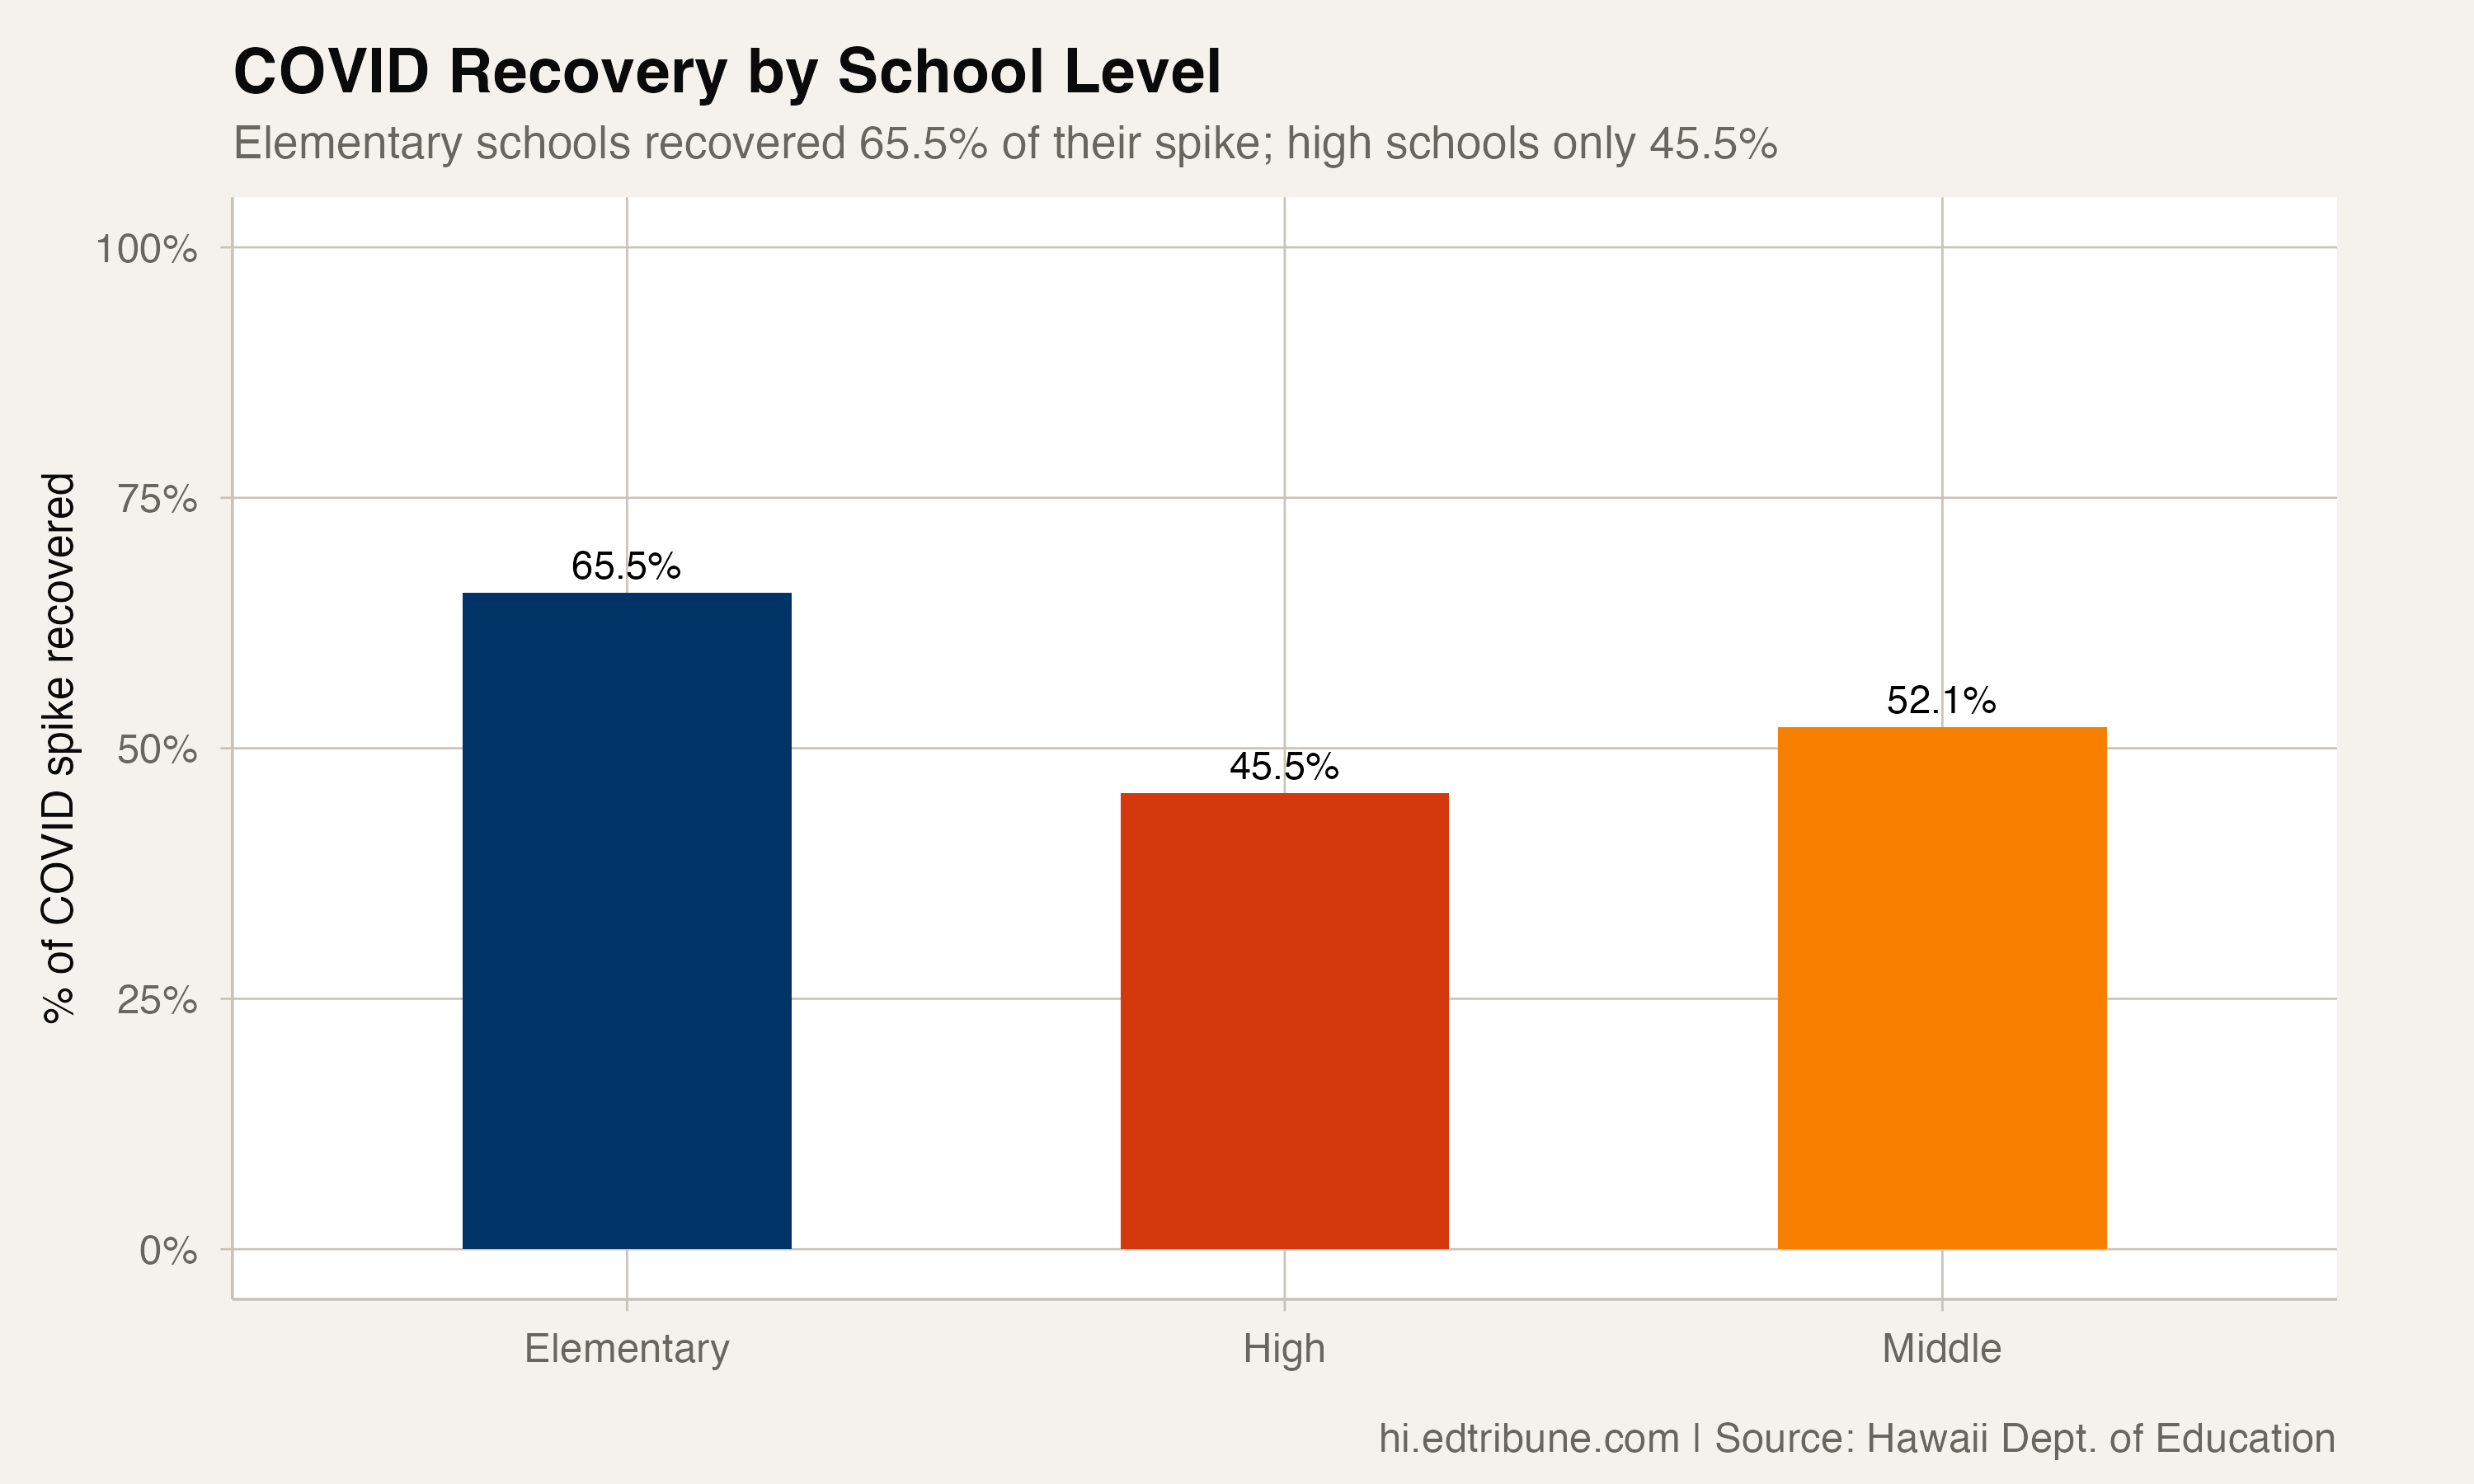
Correction (September 30, 2026): An earlier version said elementary schools had recovered 65.5% of their pandemic rise in chronic absence by 2024-25, against 51.0% for middle schools and 46.3% for high schools. Hawaii changed how it counts chronic absence in 2023-24, from students absent 15 or more days to students absent 18 or more days, so a rise measured one way cannot be set against a decline measured the other way. Those figures, and the headline built on them, have been removed. The comparisons below stay within one measure. School levels are now assigned once per school, which moves several averages by a few tenths of a point.
Correction: This article originally used an inconsistent classification for combined "High & Intermediate" schools, producing incorrect Middle and High school averages. The corrected figures use a consistent name-based classification.
Hawaii's elementary schools took the biggest attendance hit of the pandemic, and they have also posted the biggest improvements since. That holds under both of the state's attendance measures. High schools rose least during the pandemic, improved least afterward, and had the highest average rate in 2024-25.
The figures here are averages of school rates, with each school counted once regardless of size. They cover 174 elementary, 38 middle, and 39 high schools that reported a rate in every year from 2018-19 through 2024-25, grouped by the level in each school's name.
Under the Older Measure
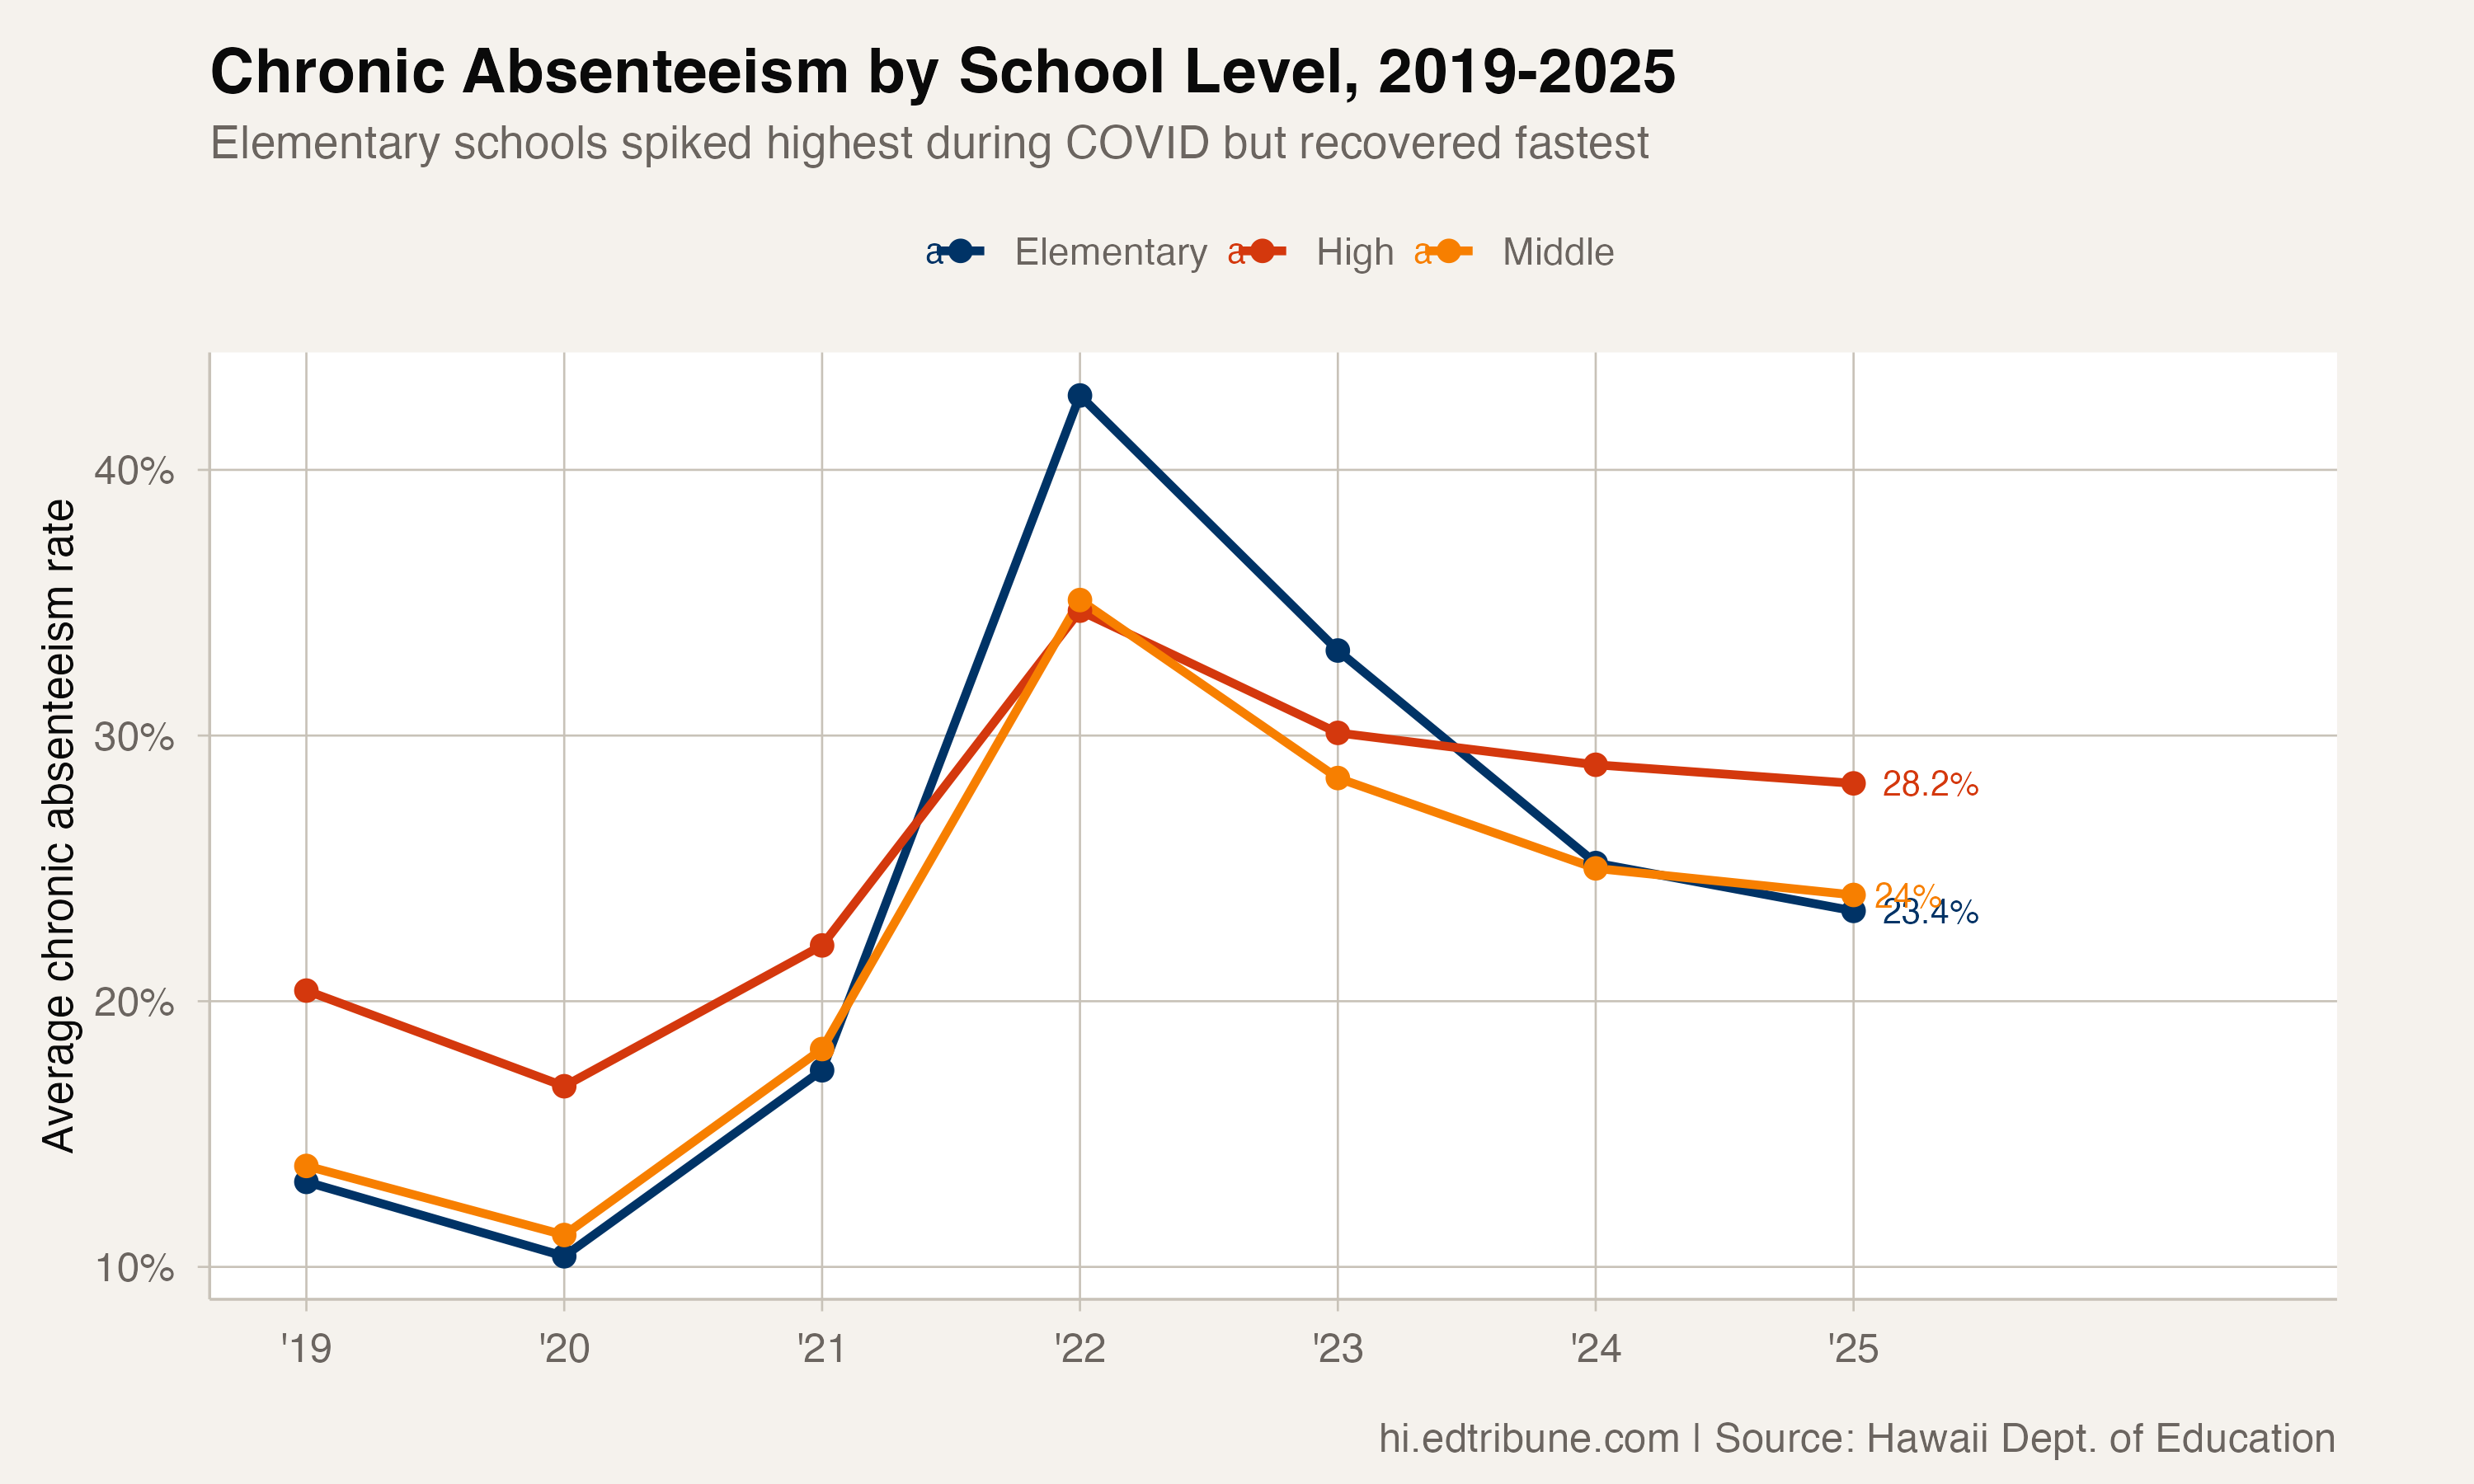
Through 2022-23, Hawaii counted a student as chronically absent after 15 or more days out. On that measure, the average elementary school's rate climbed from 13.3% in 2018-19 to 43.1% in 2021-22, a rise of 29.8 points. Middle schools rose 21.2 points, from 13.8% to 35.0%. High schools started higher, at 20.3%, and rose 14.2 points to 34.5%.
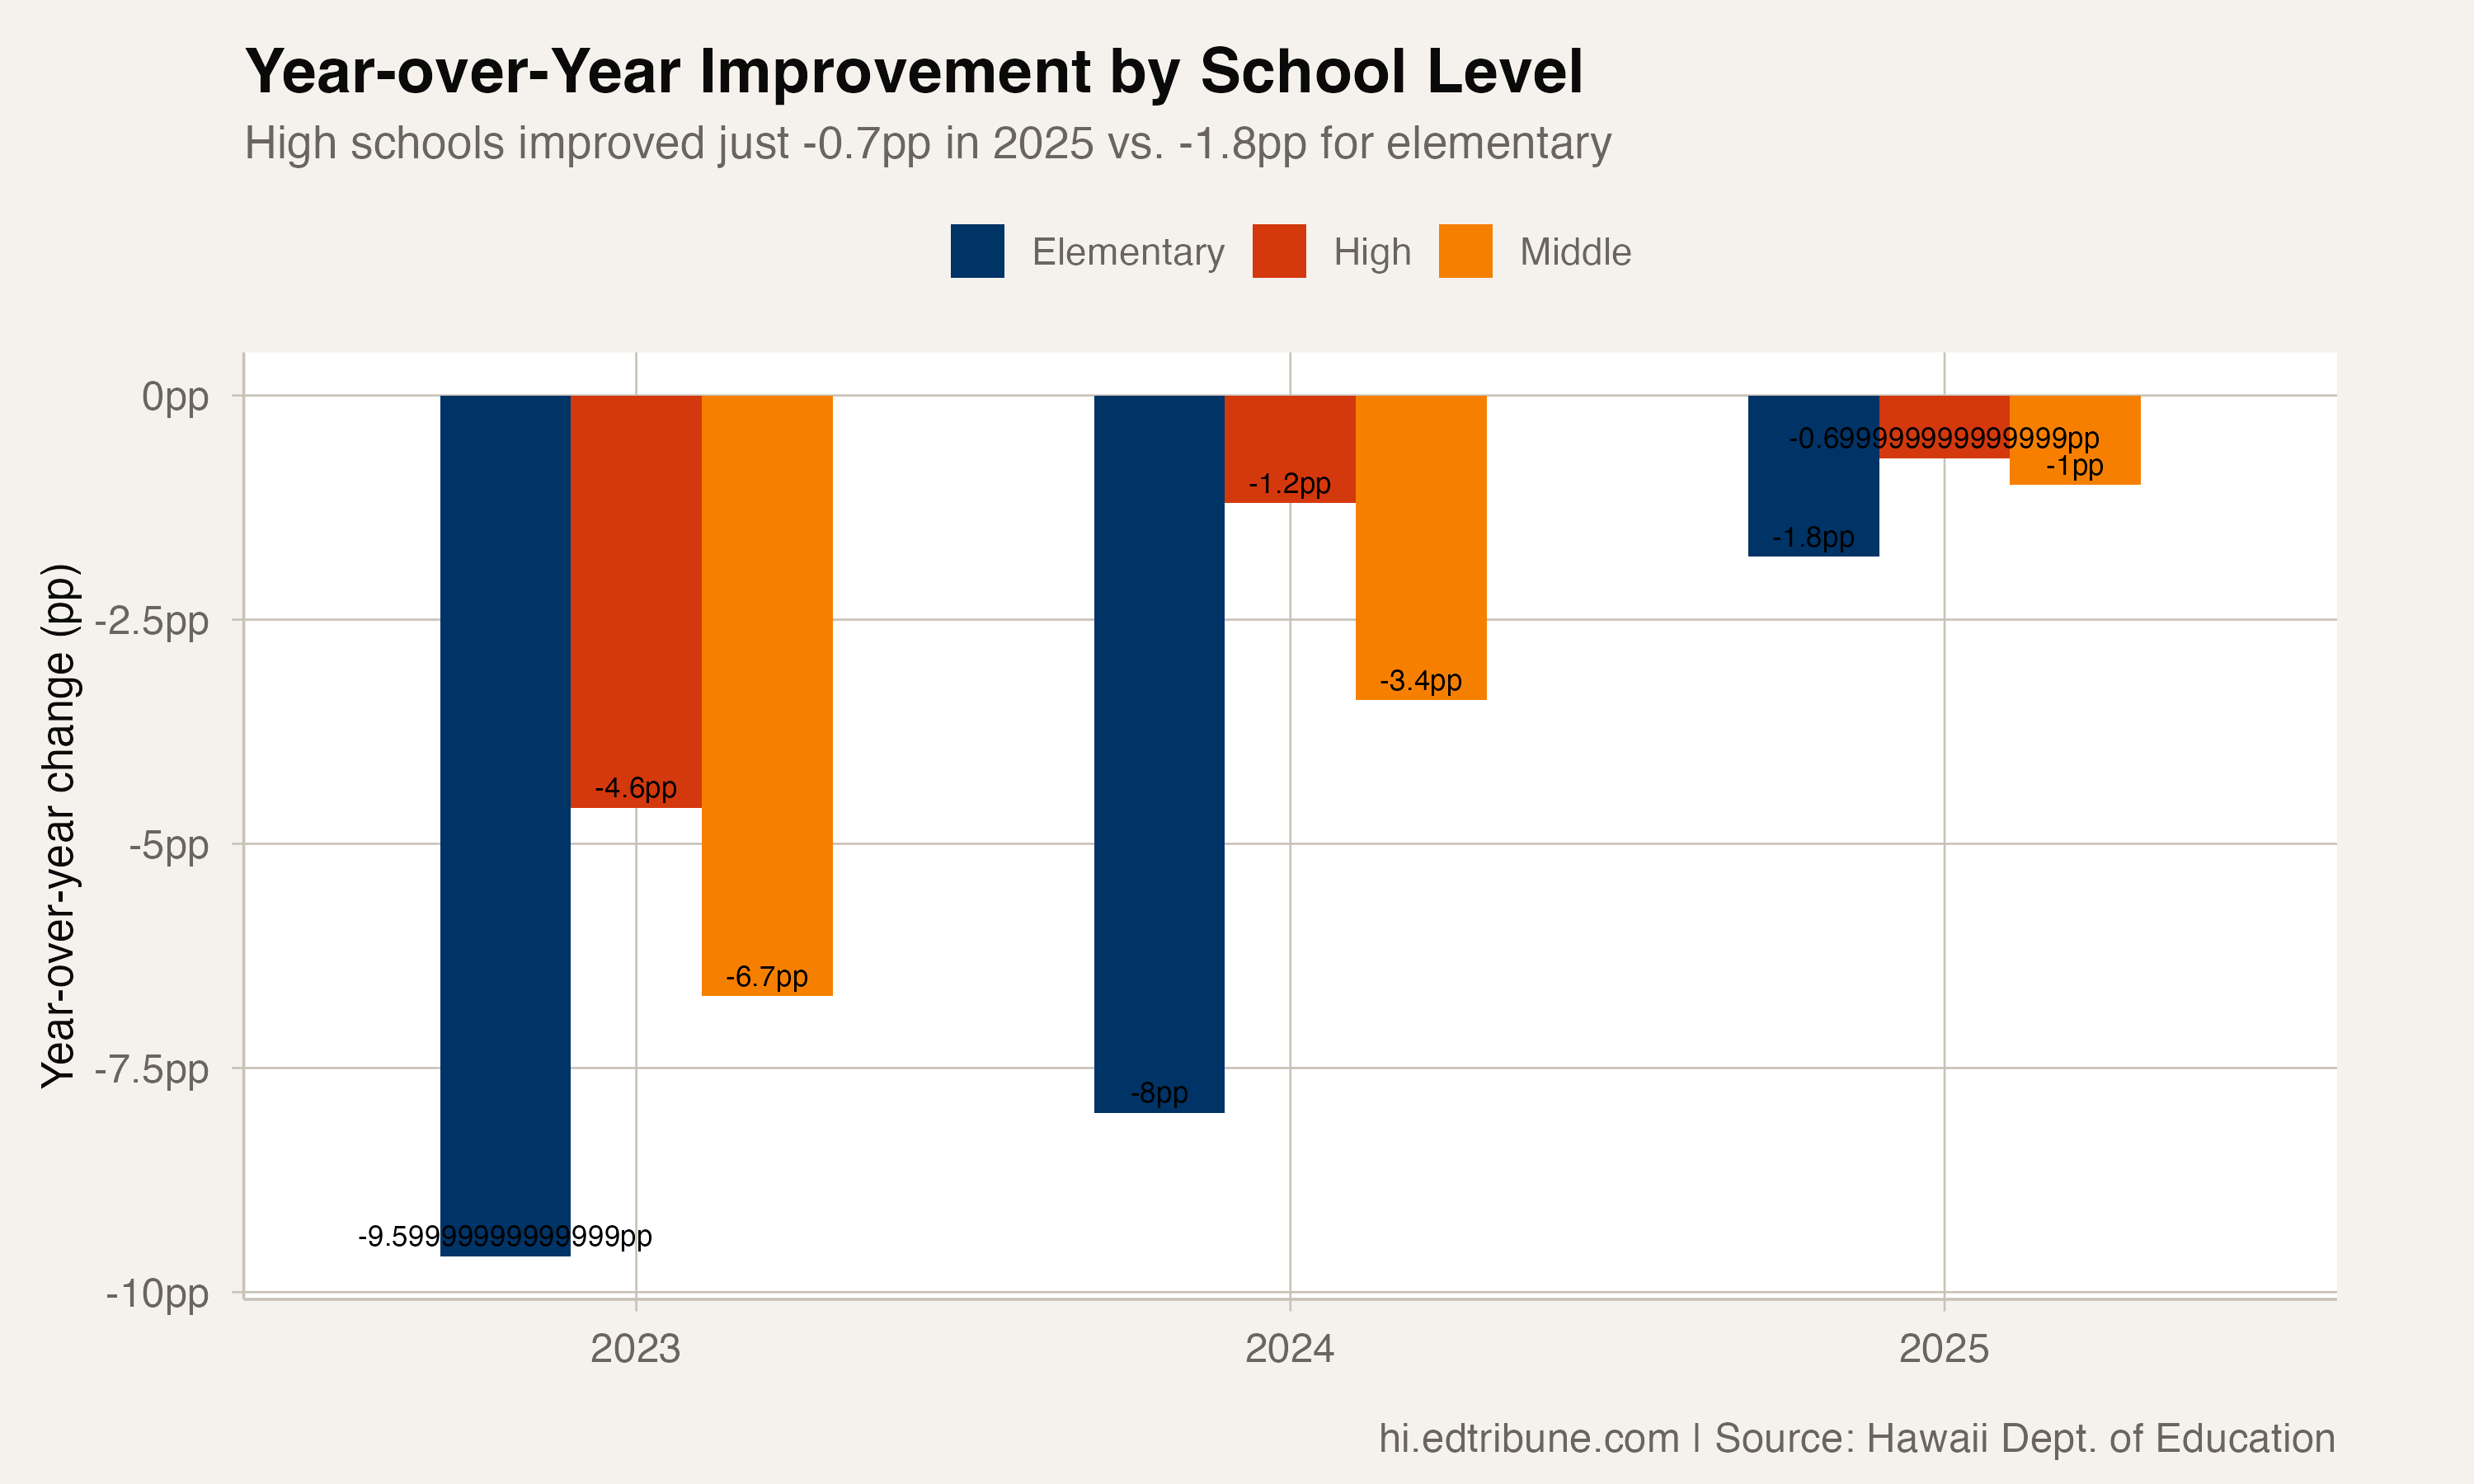
The next year, elementary averages fell 9.5 points, to 33.6%. Middle schools fell 6.6 points, to 28.4%, and high schools fell 4.8 points, to 29.7%. Measured against the size of each level's rise, the three were close: elementary schools had given back 32% of their rise by 2022-23, middle schools 31%, and high schools 34%. Elementary schools moved most in points because they had the most ground to recover.
Under the Newer Measure
Beginning in 2023-24, the state's chronic absence figure counts students absent 18 or more days. On that measure, the average elementary school's rate fell 1.8 points, from 25.3% in 2023-24 to 23.5% in 2024-25. Middle schools fell 0.9 points, from 25.0% to 24.1%. High schools fell 0.5 points, from 28.0% to 27.5%, and were the highest of the three levels in both years, 4.0 points above elementary schools in 2024-25.
The rates on the two sides of the change are not directly comparable. Figures from 2023-24 on run lower partly because a student has to miss more days to be counted.
What the Levels Have in Common
The pattern is consistent: elementary averages moved most in both periods, and high school averages moved least. Under the older measure, each level's first-year decline was about a third of its pandemic rise.
Why high schools move more slowly is a question the state's attendance files cannot answer. Older students have more say over whether they go to school, more of them work, and more of them get themselves to class. Any of those could slow a high school's improvement, and the files record none of them.
What the data do show is that a single statewide rate hides three different paths. Saying that attendance is improving is accurate at every level, but it describes much more movement at an elementary school than at a high school.
Attendance figures come from the Hawaii Department of Education's school accountability reports, covering 2018-19 through 2024-25.
Detailed code that reproduces the analysis and figures in this article is available exclusively to EdTribune subscribers.
Discussion
Sign in to join the discussion.
Loading comments...