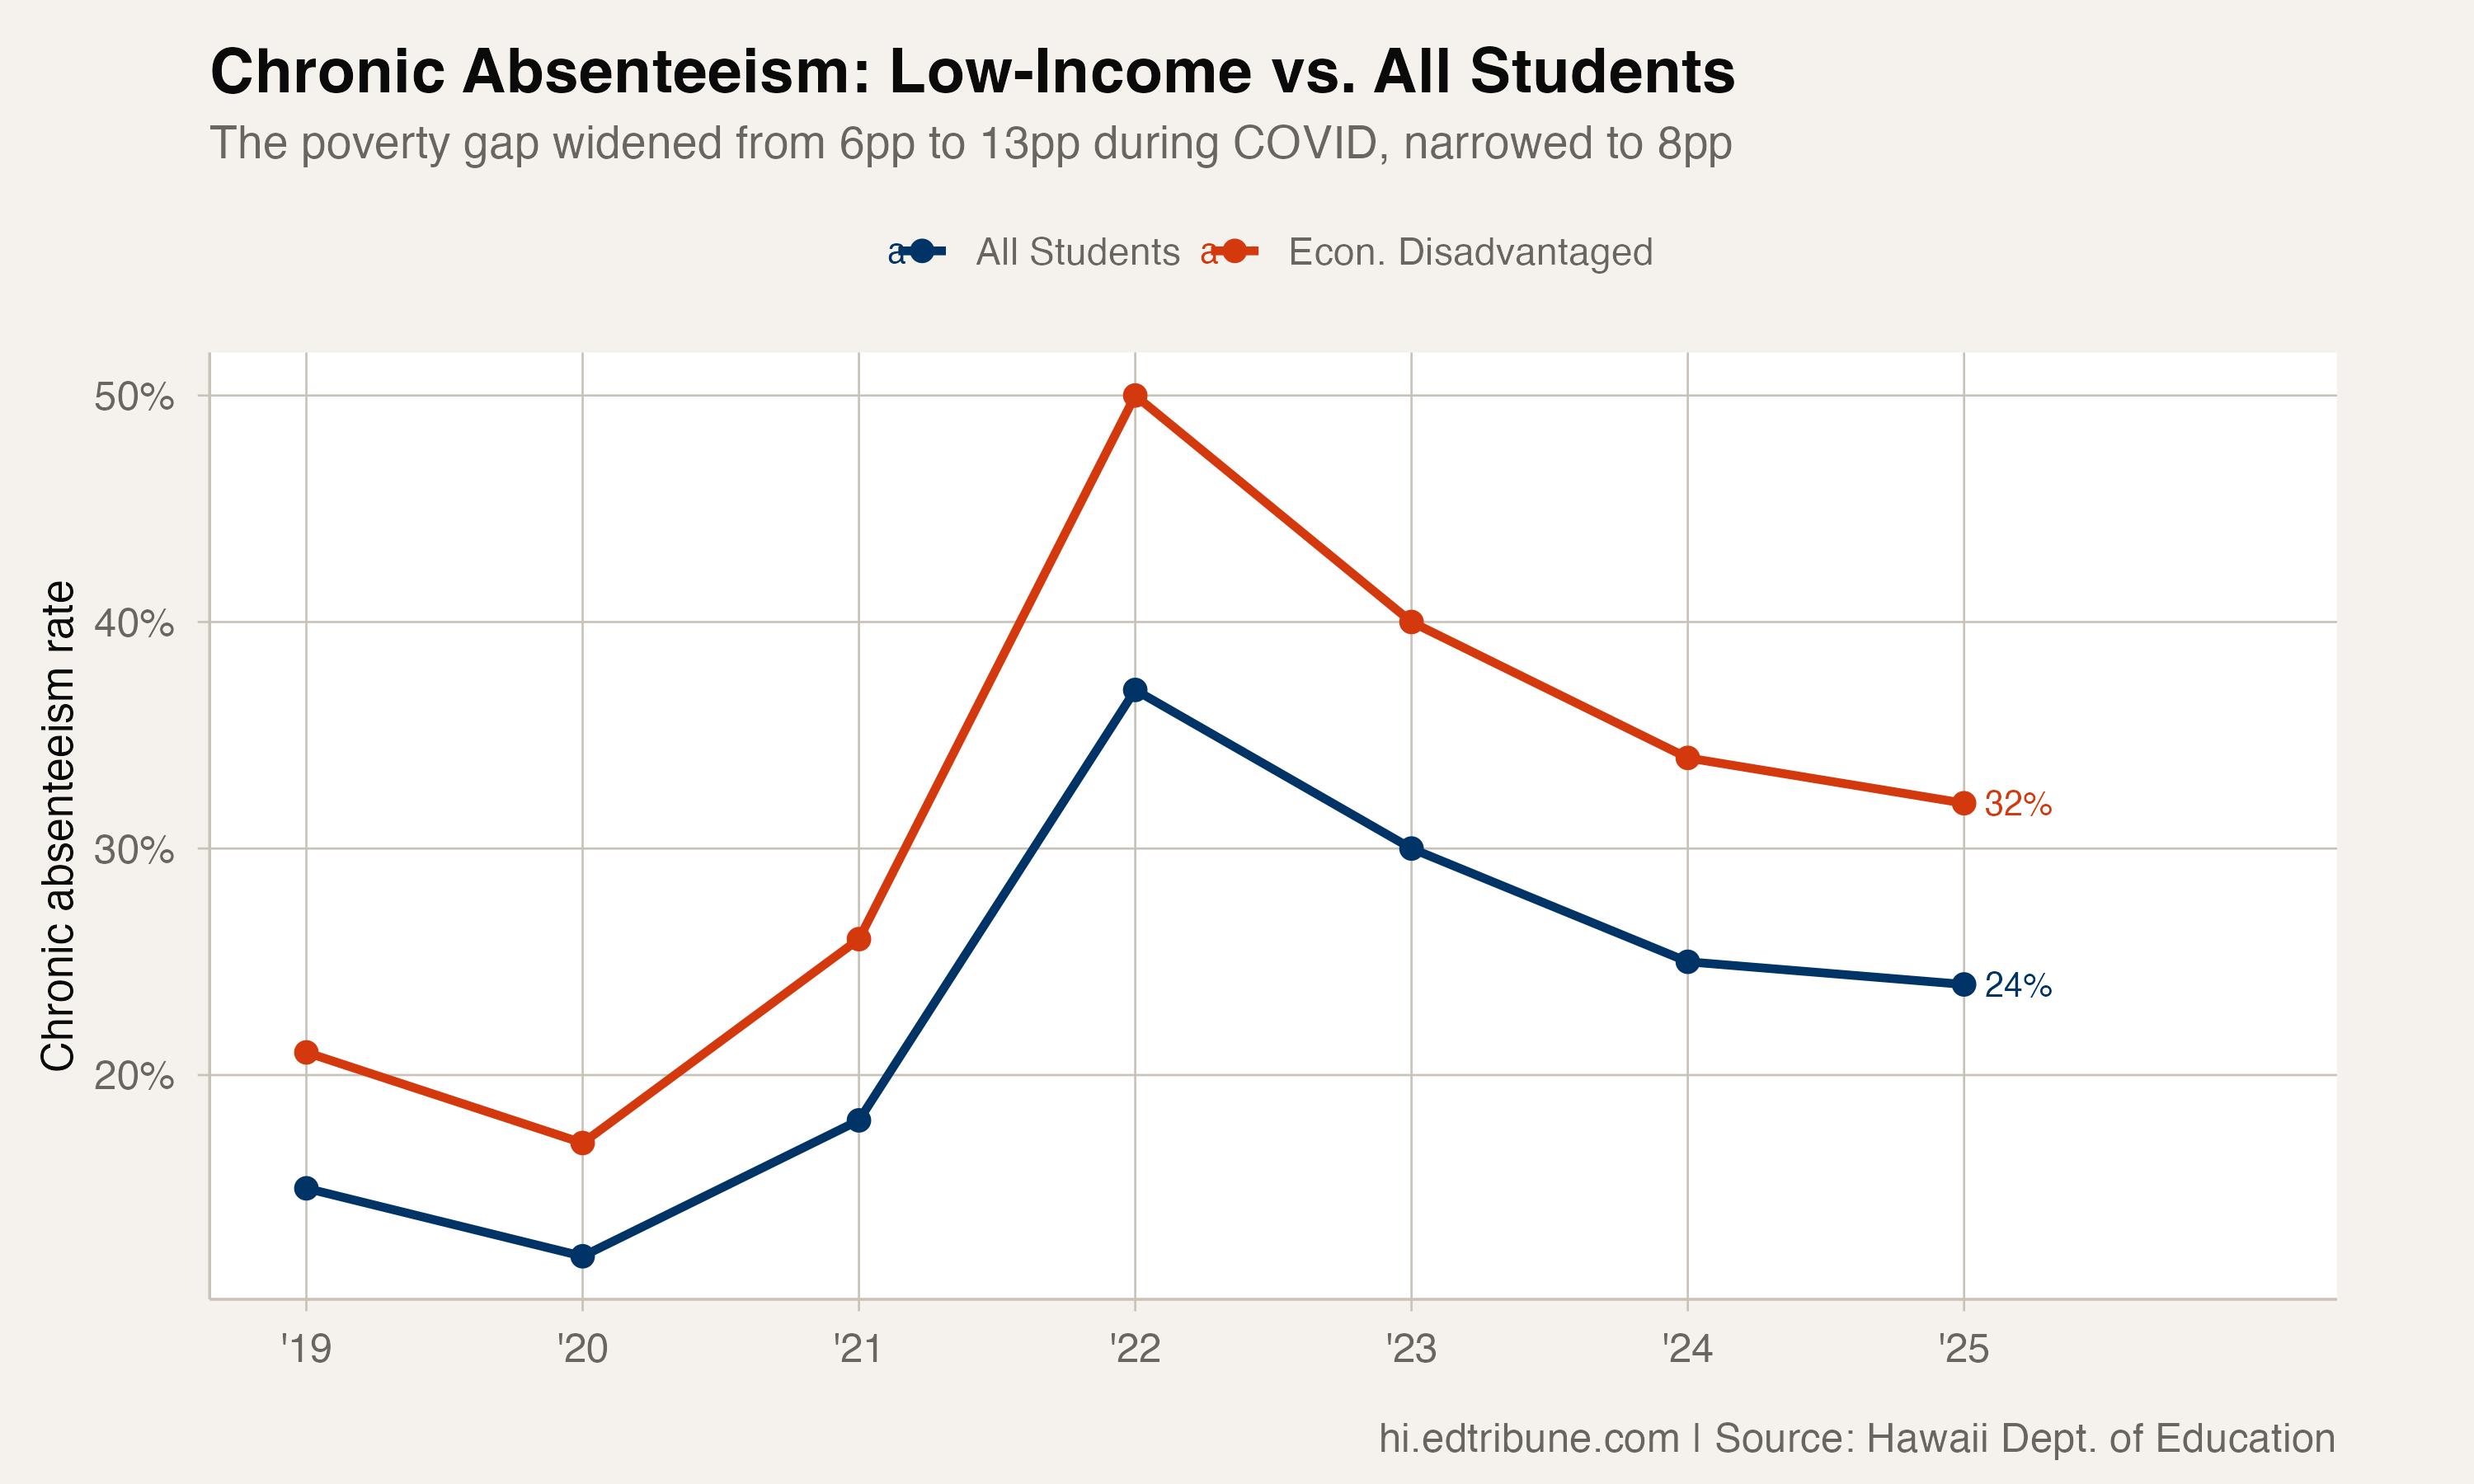
Before the pandemic, 21% of economically disadvantaged students in Hawaii were chronically absent. That was already a problem -- six percentage points above the state average of 15%. COVID drove the rate to 50%. Half of all low-income students were missing more than 15 days of school.
Three years of recovery have brought the rate down to 32%. Progress, but a number that still means one in three low-income students is chronically absent, and the gap with the overall student population remains wider than it was before the pandemic.
The Poverty Gap Widened and Won't Close
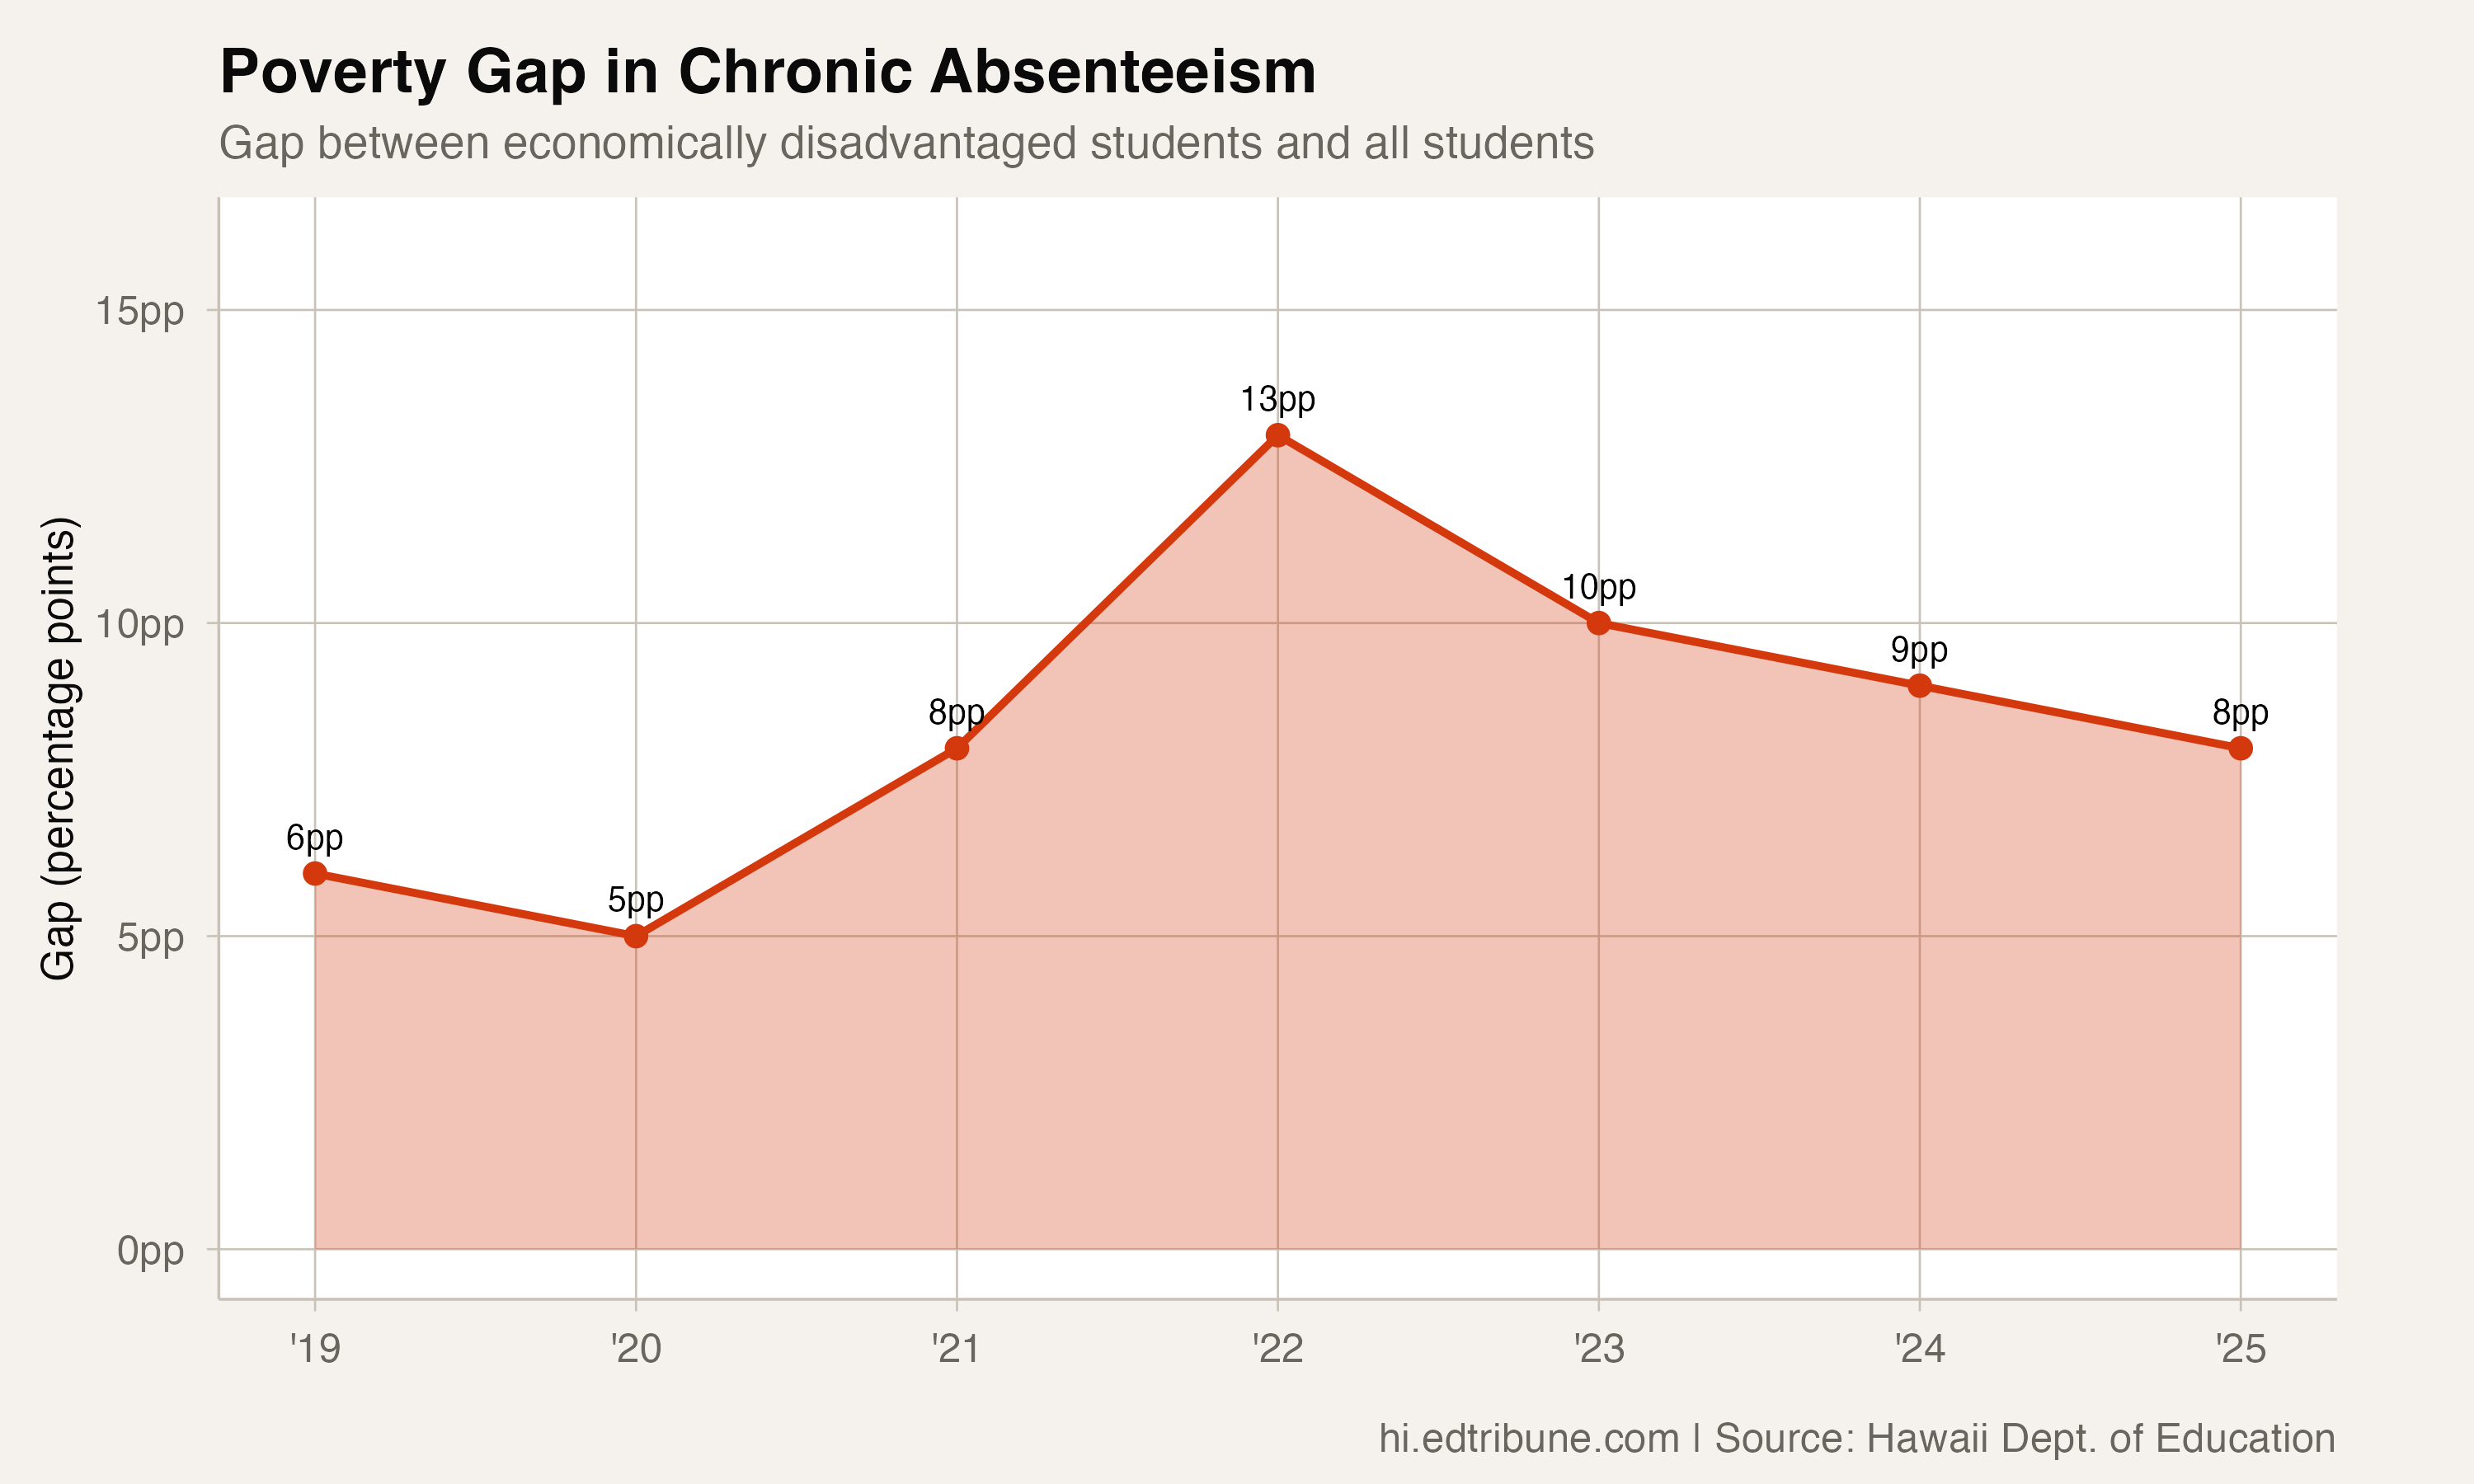
The gap between economically disadvantaged students and all students followed a predictable pattern: it existed before COVID (6pp), exploded during the crisis (13pp in 2022), and has partially narrowed (8pp in 2025). But partially is the key word. The 2025 gap of 8 percentage points is a third larger than the pre-COVID gap of 6.
| Year | All Students | Econ. Disadv. | Gap |
|---|---|---|---|
| 2019 | 15% | 21% | 6pp |
| 2020 | 12% | 17% | 5pp |
| 2021 | 18% | 26% | 8pp |
| 2022 | 37% | 50% | 13pp |
| 2023 | 30% | 40% | 10pp |
| 2024 | 25% | 34% | 9pp |
| 2025 | 24% | 32% | 8pp |
The gap has narrowed by just 1 percentage point in each of the last two years. At that rate, it would take until 2027 to return to the pre-COVID gap -- and even then, low-income students would still be chronically absent at rates far above their 2019 levels.
Where the Impact Is Concentrated
At the school level, the poverty gap can be far more extreme than the statewide 8-point average. Kamilo'iki Elementary has a 22-percentage-point gap: its overall chronic rate is 14%, but for economically disadvantaged students it is 36%. Niu Valley Middle shows a 17-point gap: 11% overall, 28% for low-income students.
The schools with the highest economically disadvantaged chronic rates are familiar names: Olomana School (77%), Ho'okena Elementary (63%), Connections PCS (61%), and a cluster of Waianae Coast schools in the mid-50s. These are schools where poverty is not a subgroup -- it is the dominant condition of the student body.
Poverty Intersects with Everything Else
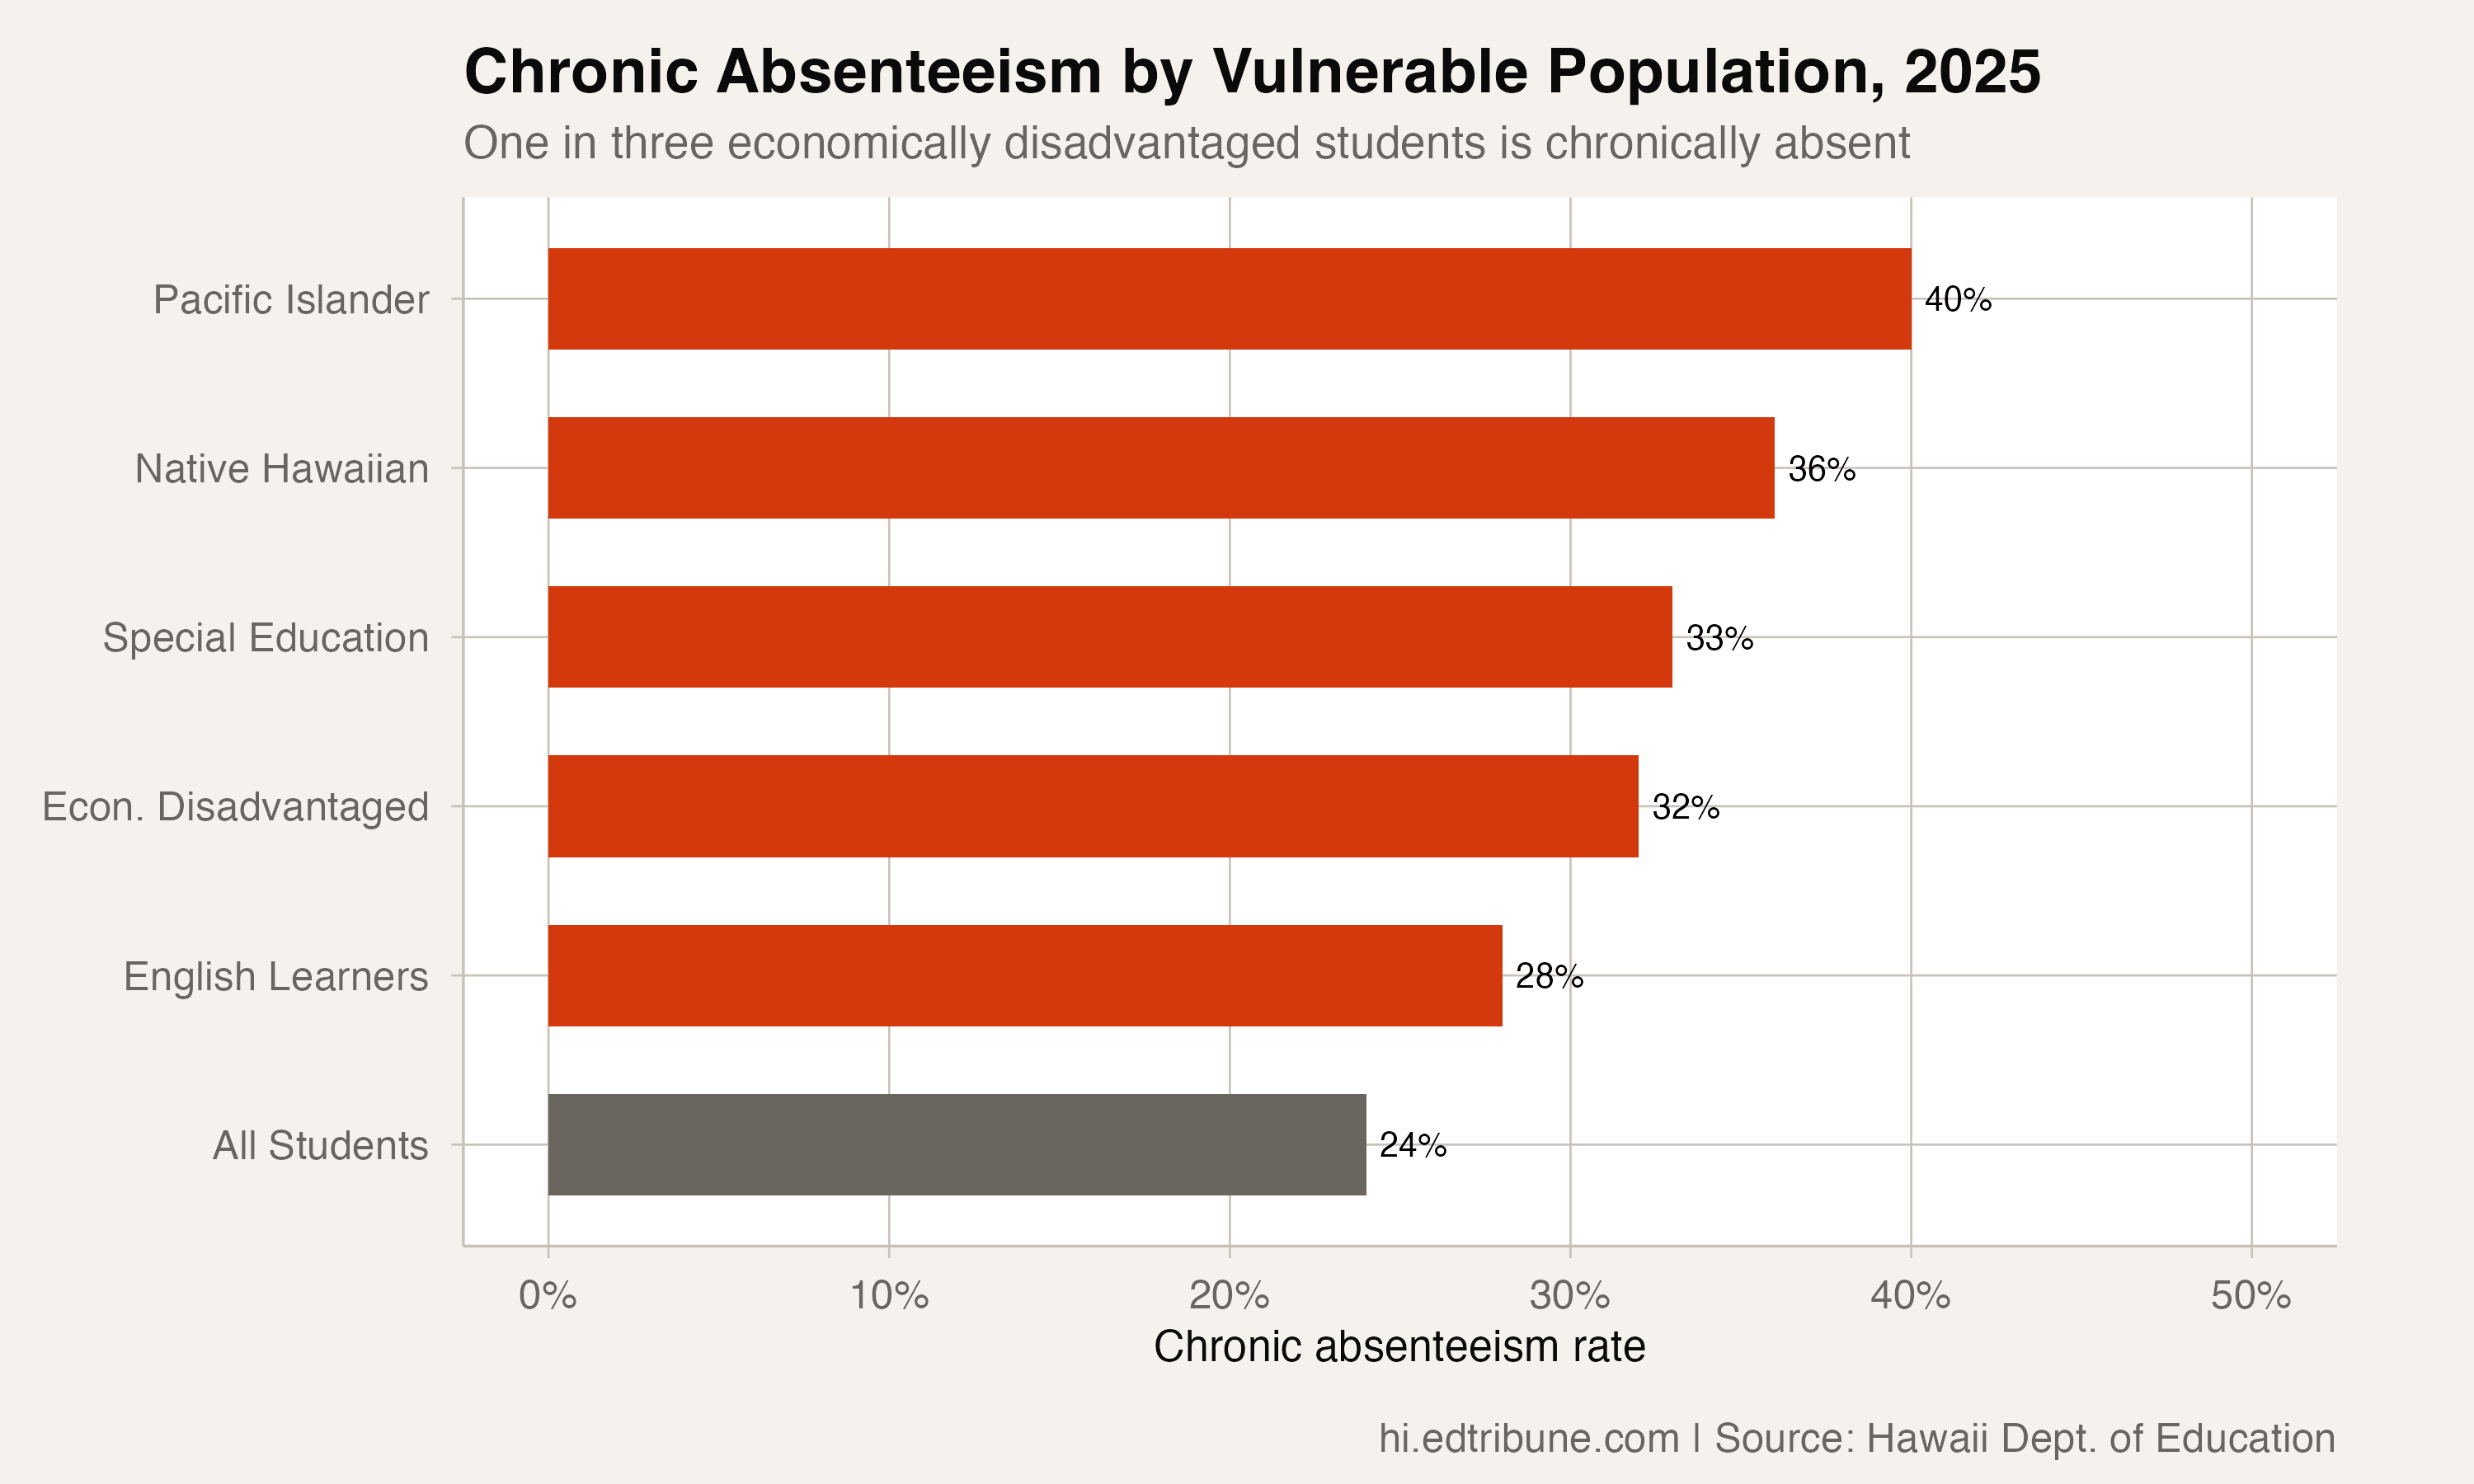
The 32% rate for low-income students doesn't sit alone in the data. It stacks on top of -- and heavily overlaps with -- the racial gaps visible elsewhere in Hawaii's attendance numbers:
- Pacific Islander: 40%
- Native Hawaiian: 36%
- Special Education: 33%
- Economically Disadvantaged: 32%
- English Learners: 28%
- All Students: 24%
Many of the students counted in the "economically disadvantaged" column also show up in the Pacific Islander or Native Hawaiian columns. A student who is Pacific Islander and low-income isn't facing two separate 40% and 32% risks -- they are living one set of circumstances that produces both labels.
Housing and Health
Hawaii's cost of living -- the highest in the nation -- creates specific attendance barriers for low-income families. An estimated 5,300 students are homeless or in unstable housing, according to state education data. Hawaii is among 12 states nationally with chronic absenteeism rates above 50% for students who are currently homeless, according to the National Center for Homeless Education.
Healthcare access is the other critical barrier. For families without reliable transportation, a child's doctor appointment can mean a full day of missed school. In communities like the Waianae Coast, where one major healthcare provider serves the entire population, wait times for appointments compound the problem.
The pandemic exacerbated these conditions. Housing costs increased, homelessness grew, and mental health needs intensified -- 75% of Hawaii youth with major depression do not receive treatment, according to Mental Health America, which ranks Hawaii 49th nationally for youth mental health access.
The Hawaii Department of Education did not respond to a request for comment.
Detailed code that reproduces the analysis and figures in this article is available exclusively to EdTribune subscribers.
Discussion
Sign in to join the discussion.
Loading comments...