Correction (September 30, 2026): An earlier version of this article compared a 2022 chronic absence figure with a 2024 figure and said the rate remained 71% above pre-pandemic levels. Hawaii changed how it counts chronic absence in 2023-24, from students absent 15 or more days to students absent 18 or more days, so those years are not comparable, and the 2024 figure and comparison were attributed to a 2018 magazine article that does not contain them. Both have been removed. A quotation from that article has been restored to its exact wording and attributed to the counselor who said it, and the article's older context is now dated. Rechecking the graduation data also corrected three statements: Native Hawaiian students' 2.3-point drop in 2025 was their largest one-year decline, not the largest for any group; the spread between complex areas is not wider than every gap between racial groups; and outer-island complex areas are not uniformly above 85%.
Correction: An earlier version of this article described Native Hawaiian students' 1.6-point gain since 2017 as the smallest improvement of any group. Pacific Islander students gained just 0.7 points, a smaller improvement. The article has been updated.
In the Farrington-Kaiser-Kalani complex area, which stretches across urban Honolulu from Kalihi to Hawaii Kai, the four-year graduation rate for Native Hawaiian students dropped 10 percentage points in a single year. In the adjacent Kaimuki-McKinley-Roosevelt complex area, Native Hawaiian students graduate at 73.2%, 20 points below their Asian classmates in the same schools.
These are the sharpest edges of a statewide reversal that has erased four years of progress for Native Hawaiian students.
The reversal in three numbers
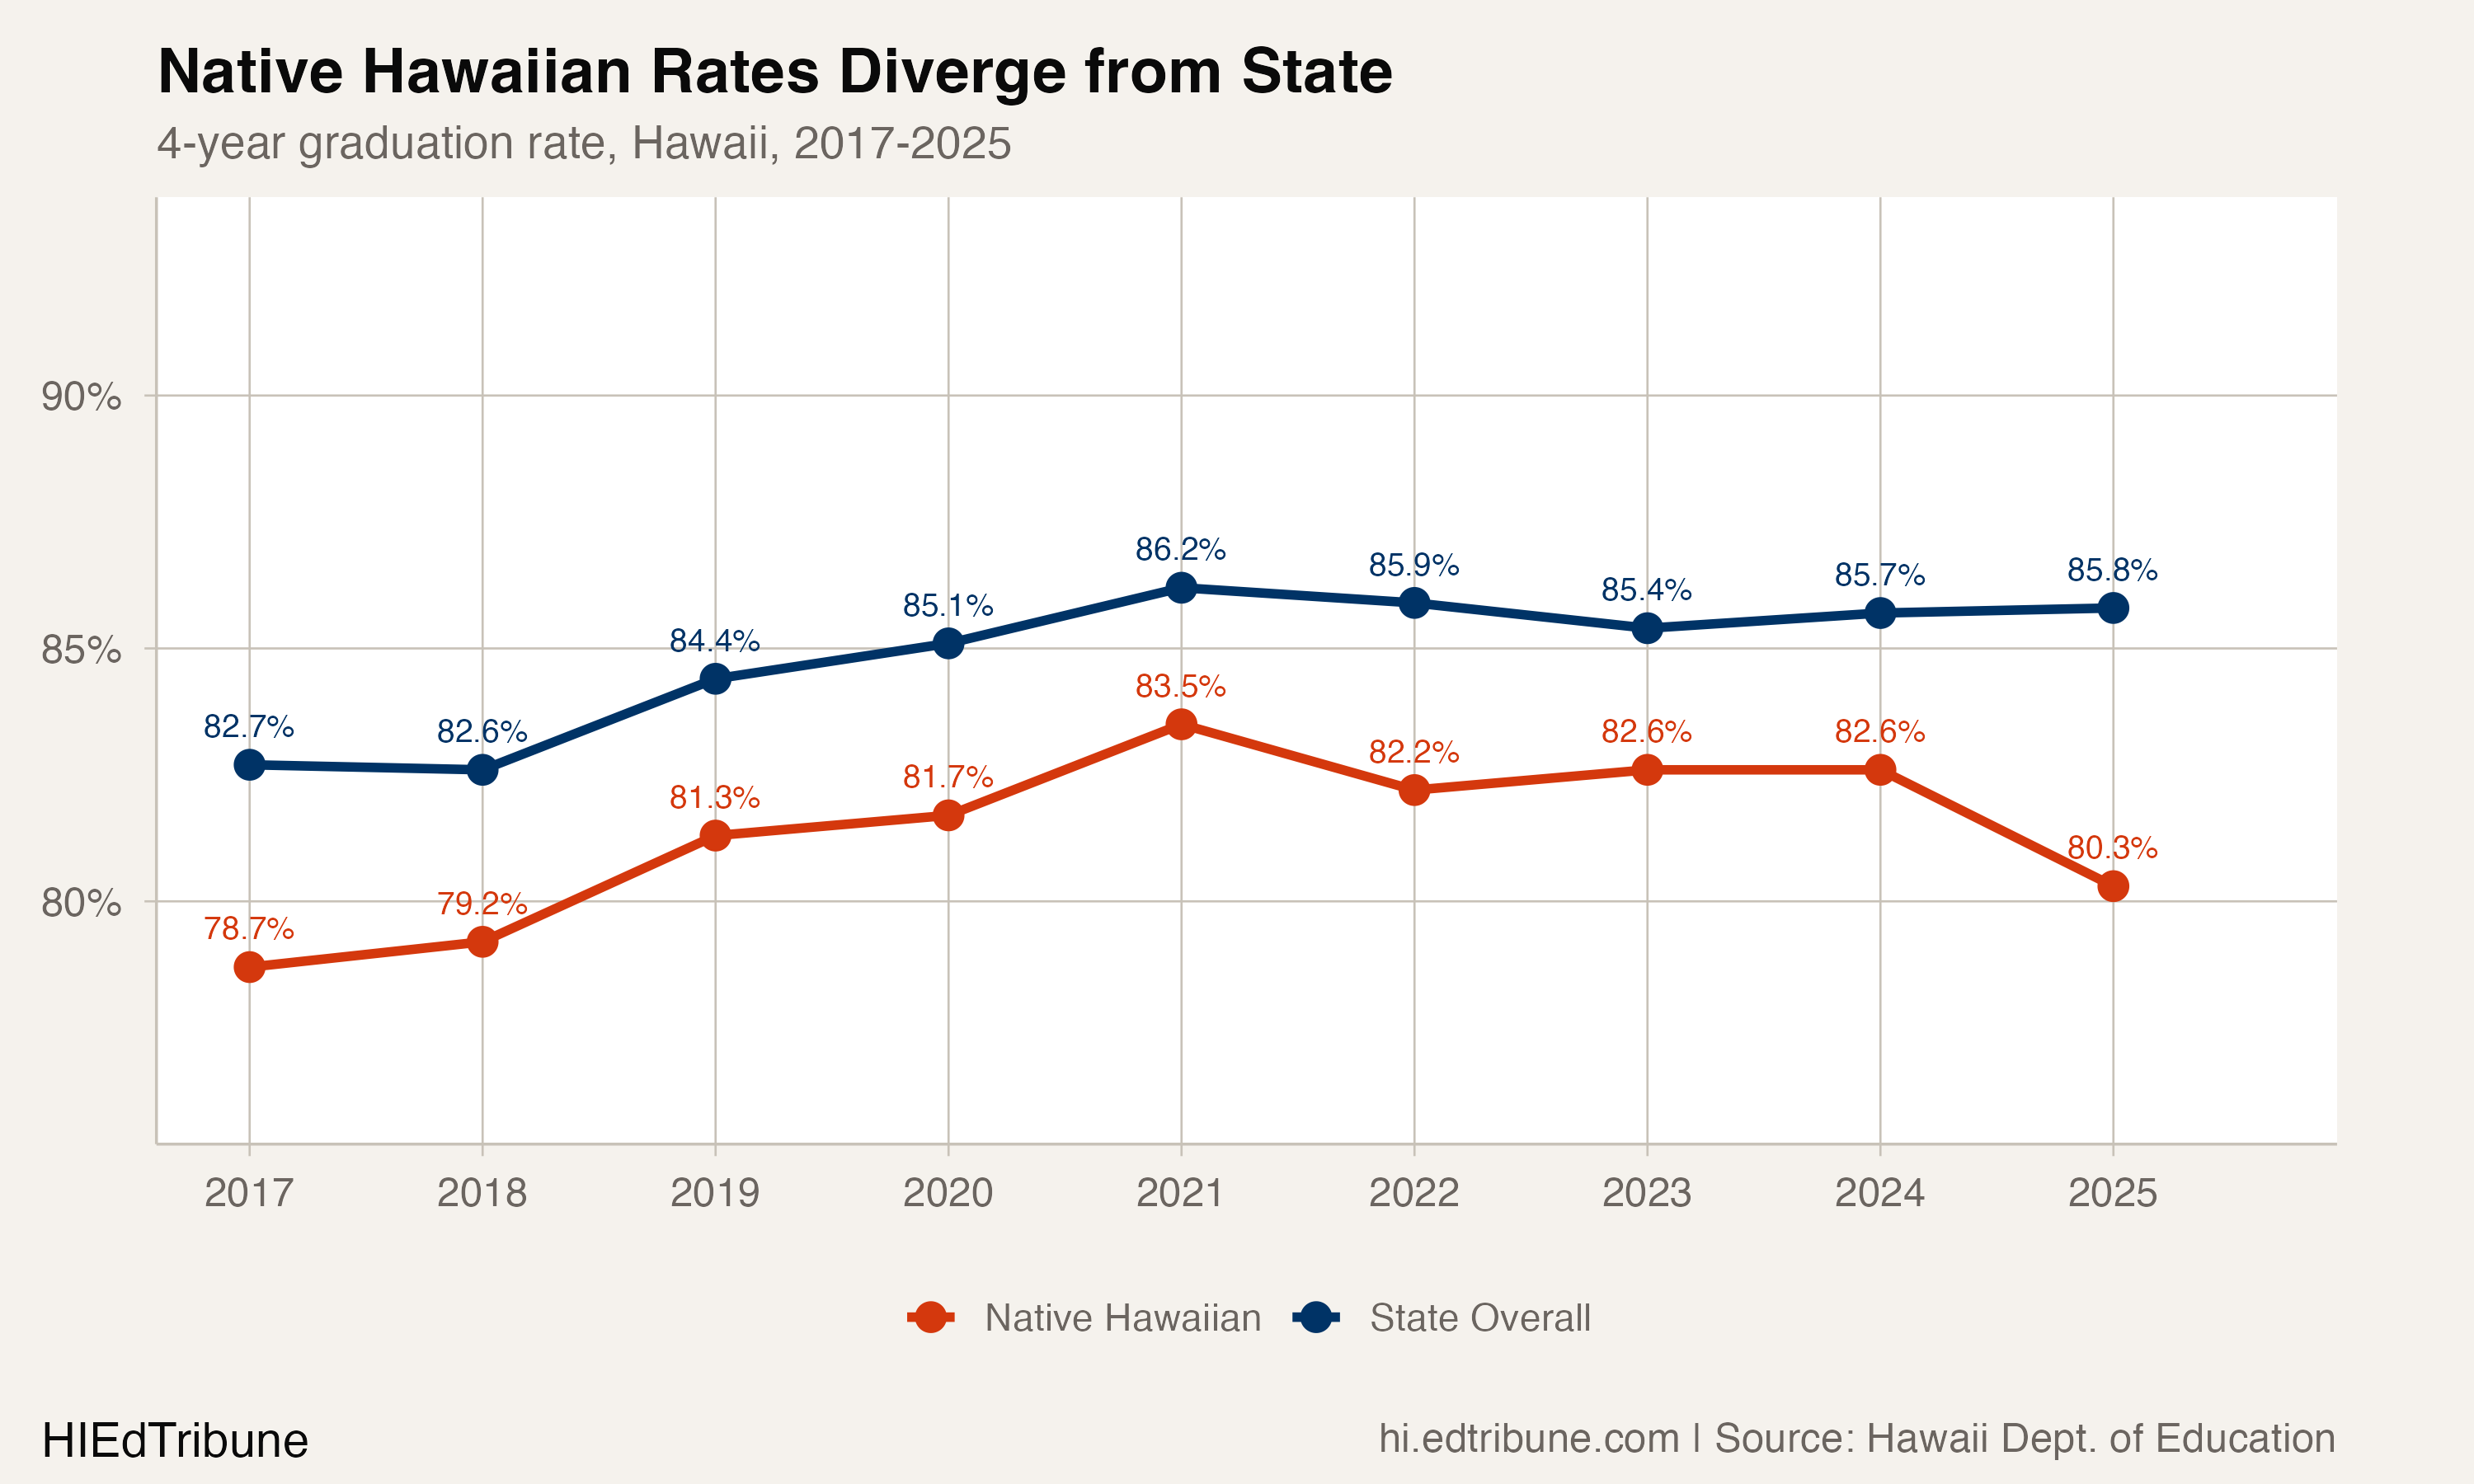
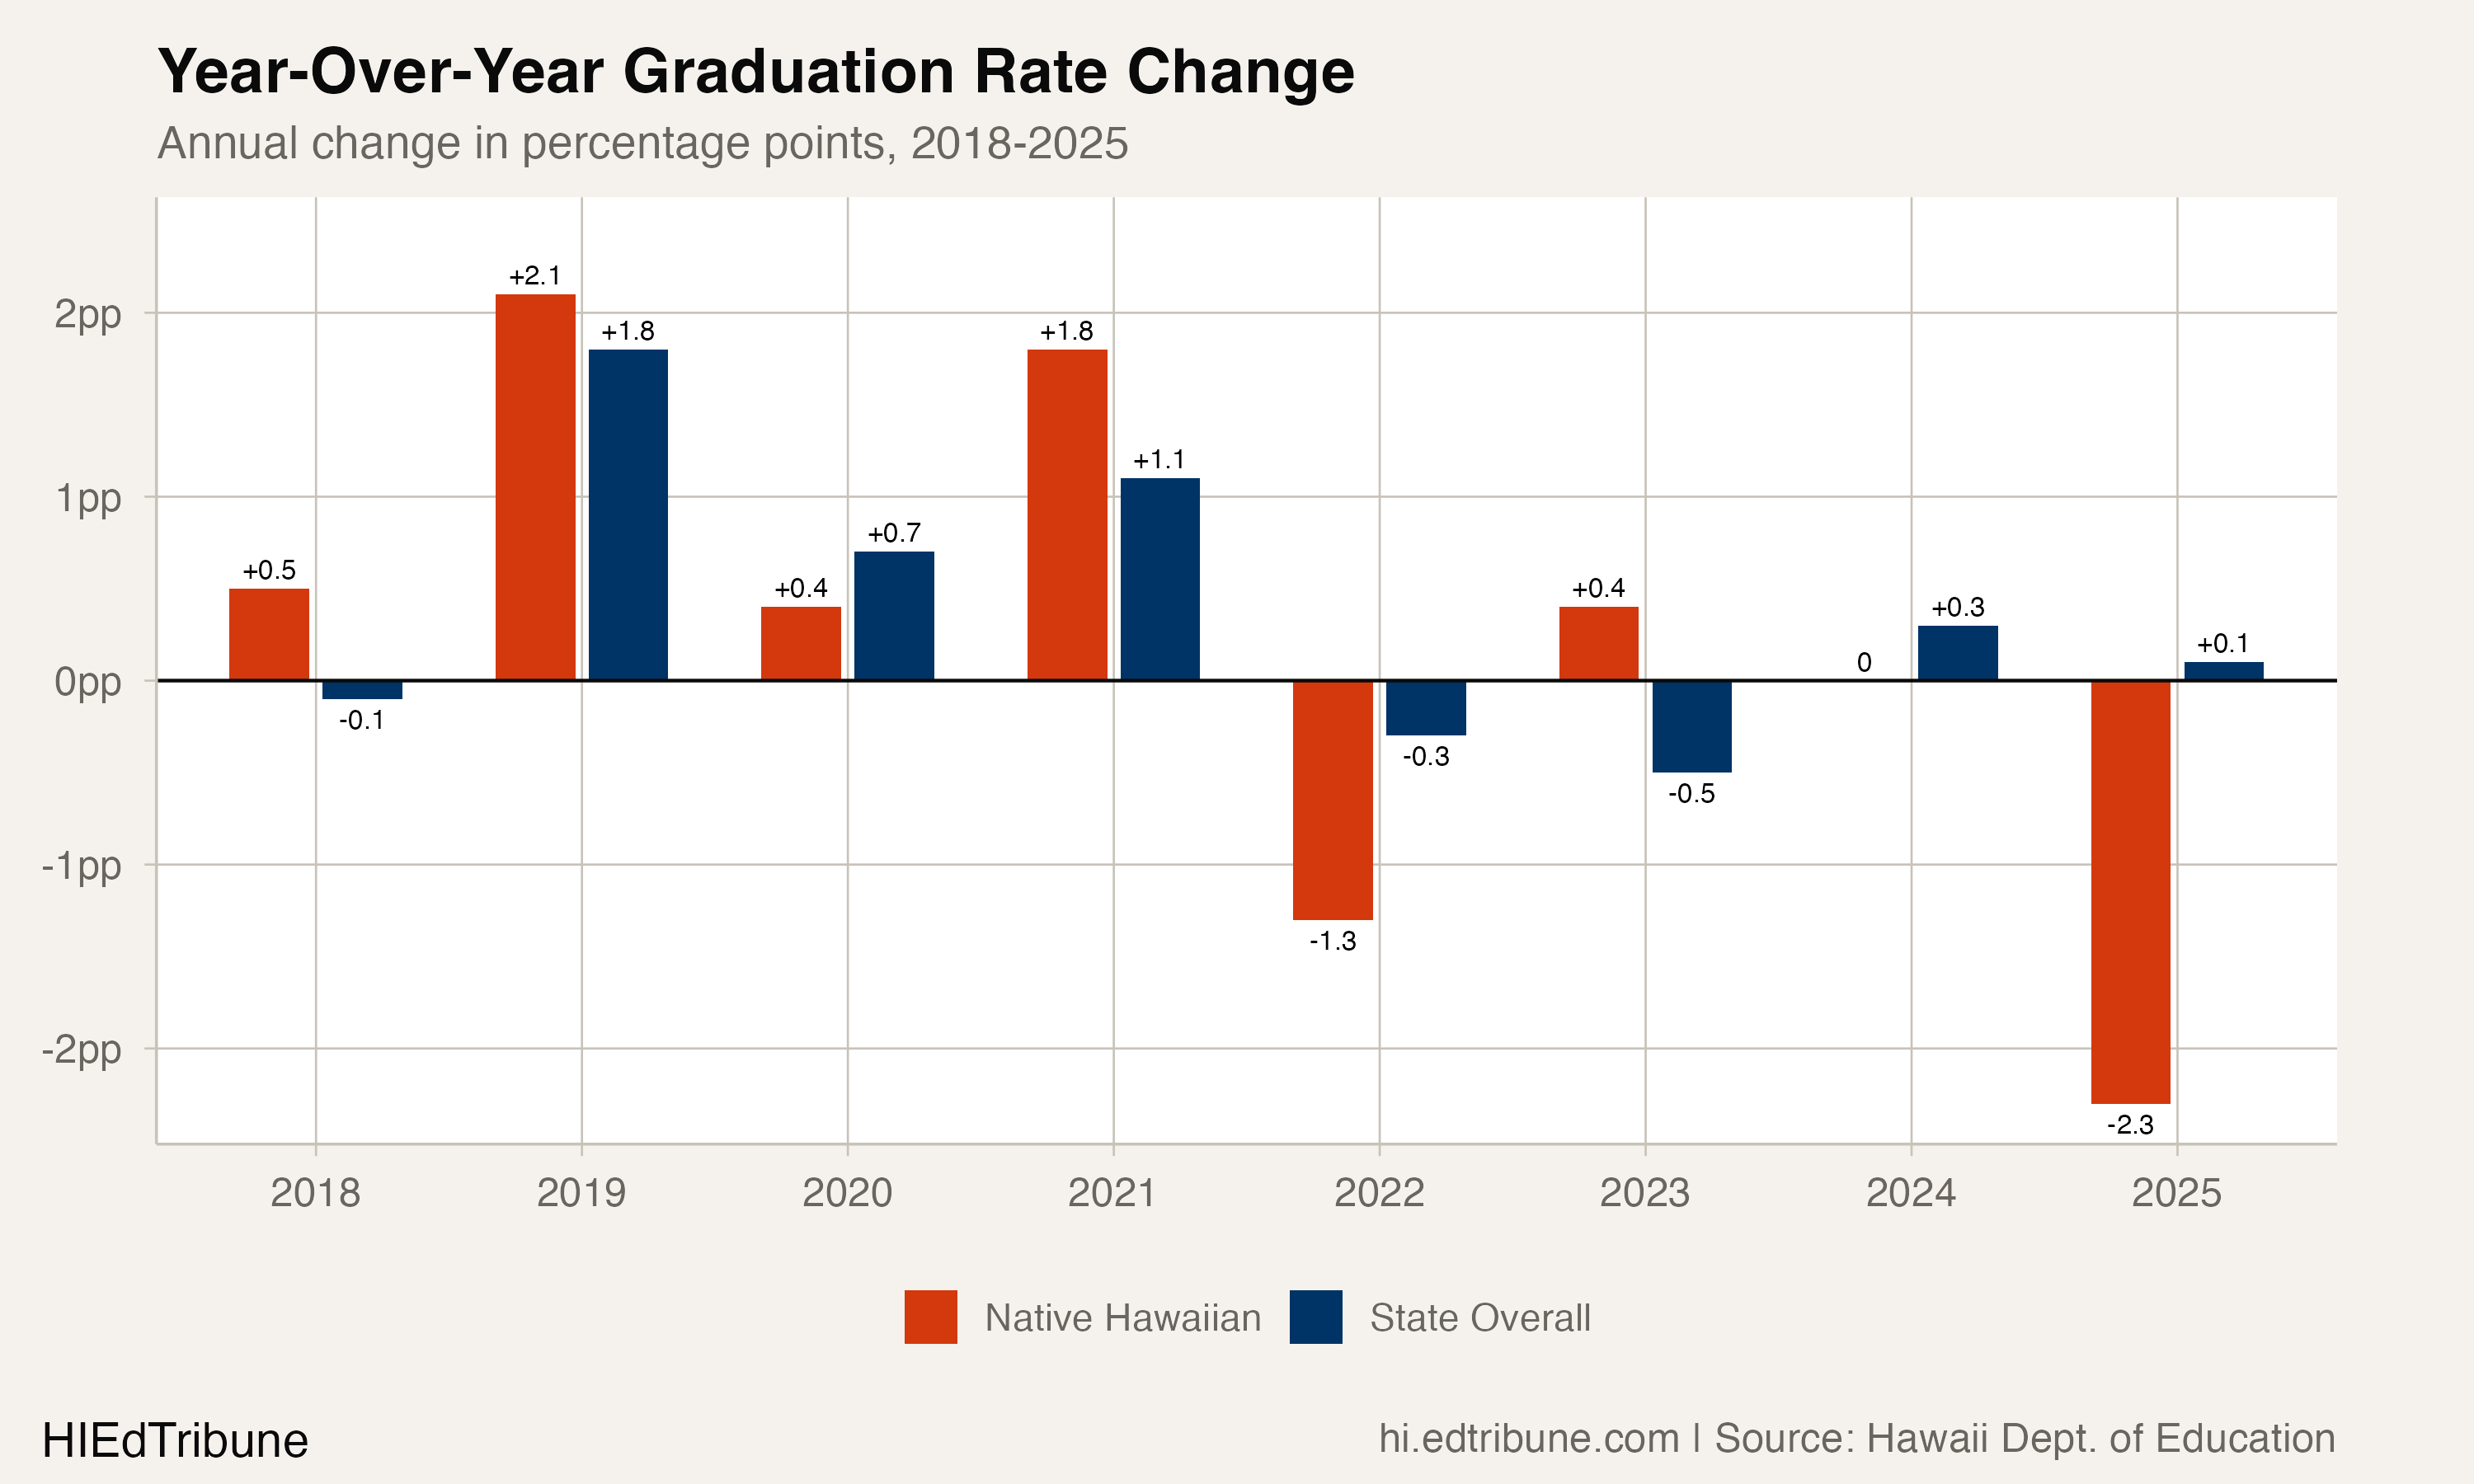
Native Hawaiian students reached a graduation rate of 83.5% in 2021, closing to within 2.7 percentage points of the state average. That was the high-water mark. By 2025, the rate had fallen to 80.3%, a decline of 3.2 percentage points, while the state overall barely moved, slipping just 0.4 points from its own 2021 peak of 86.2% to 85.8%.
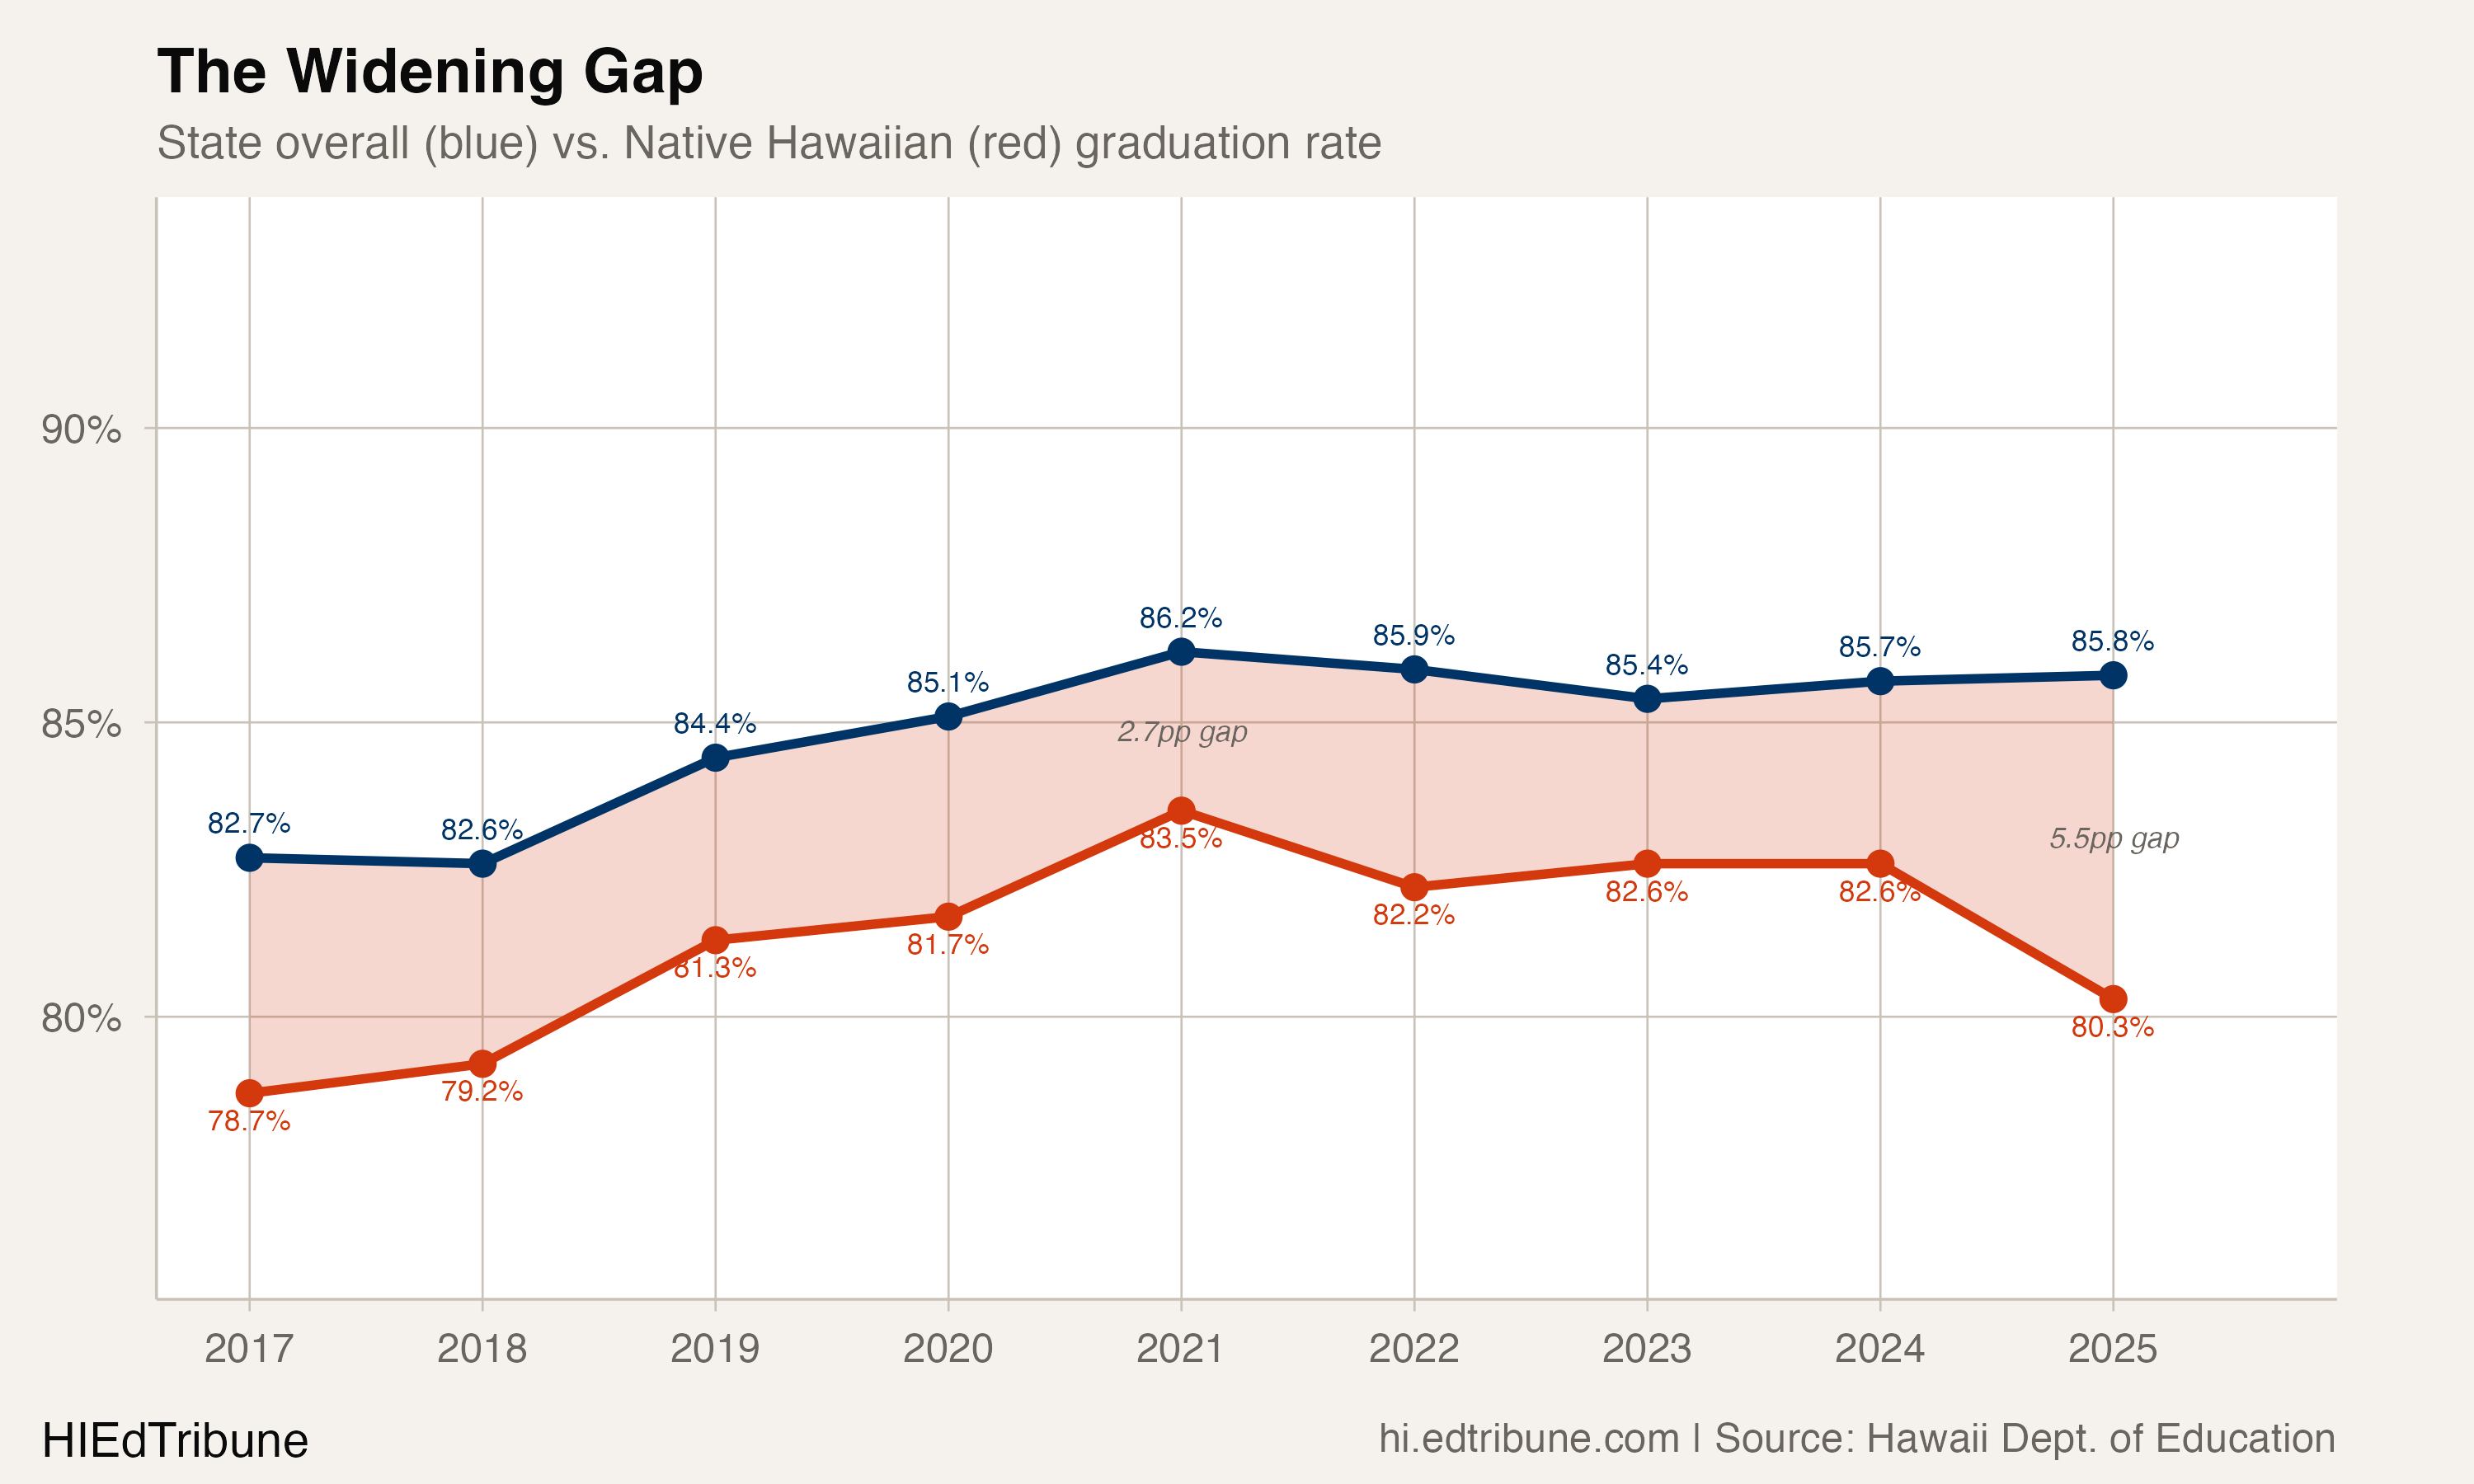
The result: the gap between Native Hawaiian students and the state average widened from 2.7 percentage points to 5.5, the largest in the nine years of race-level graduation data available, beginning in 2017.
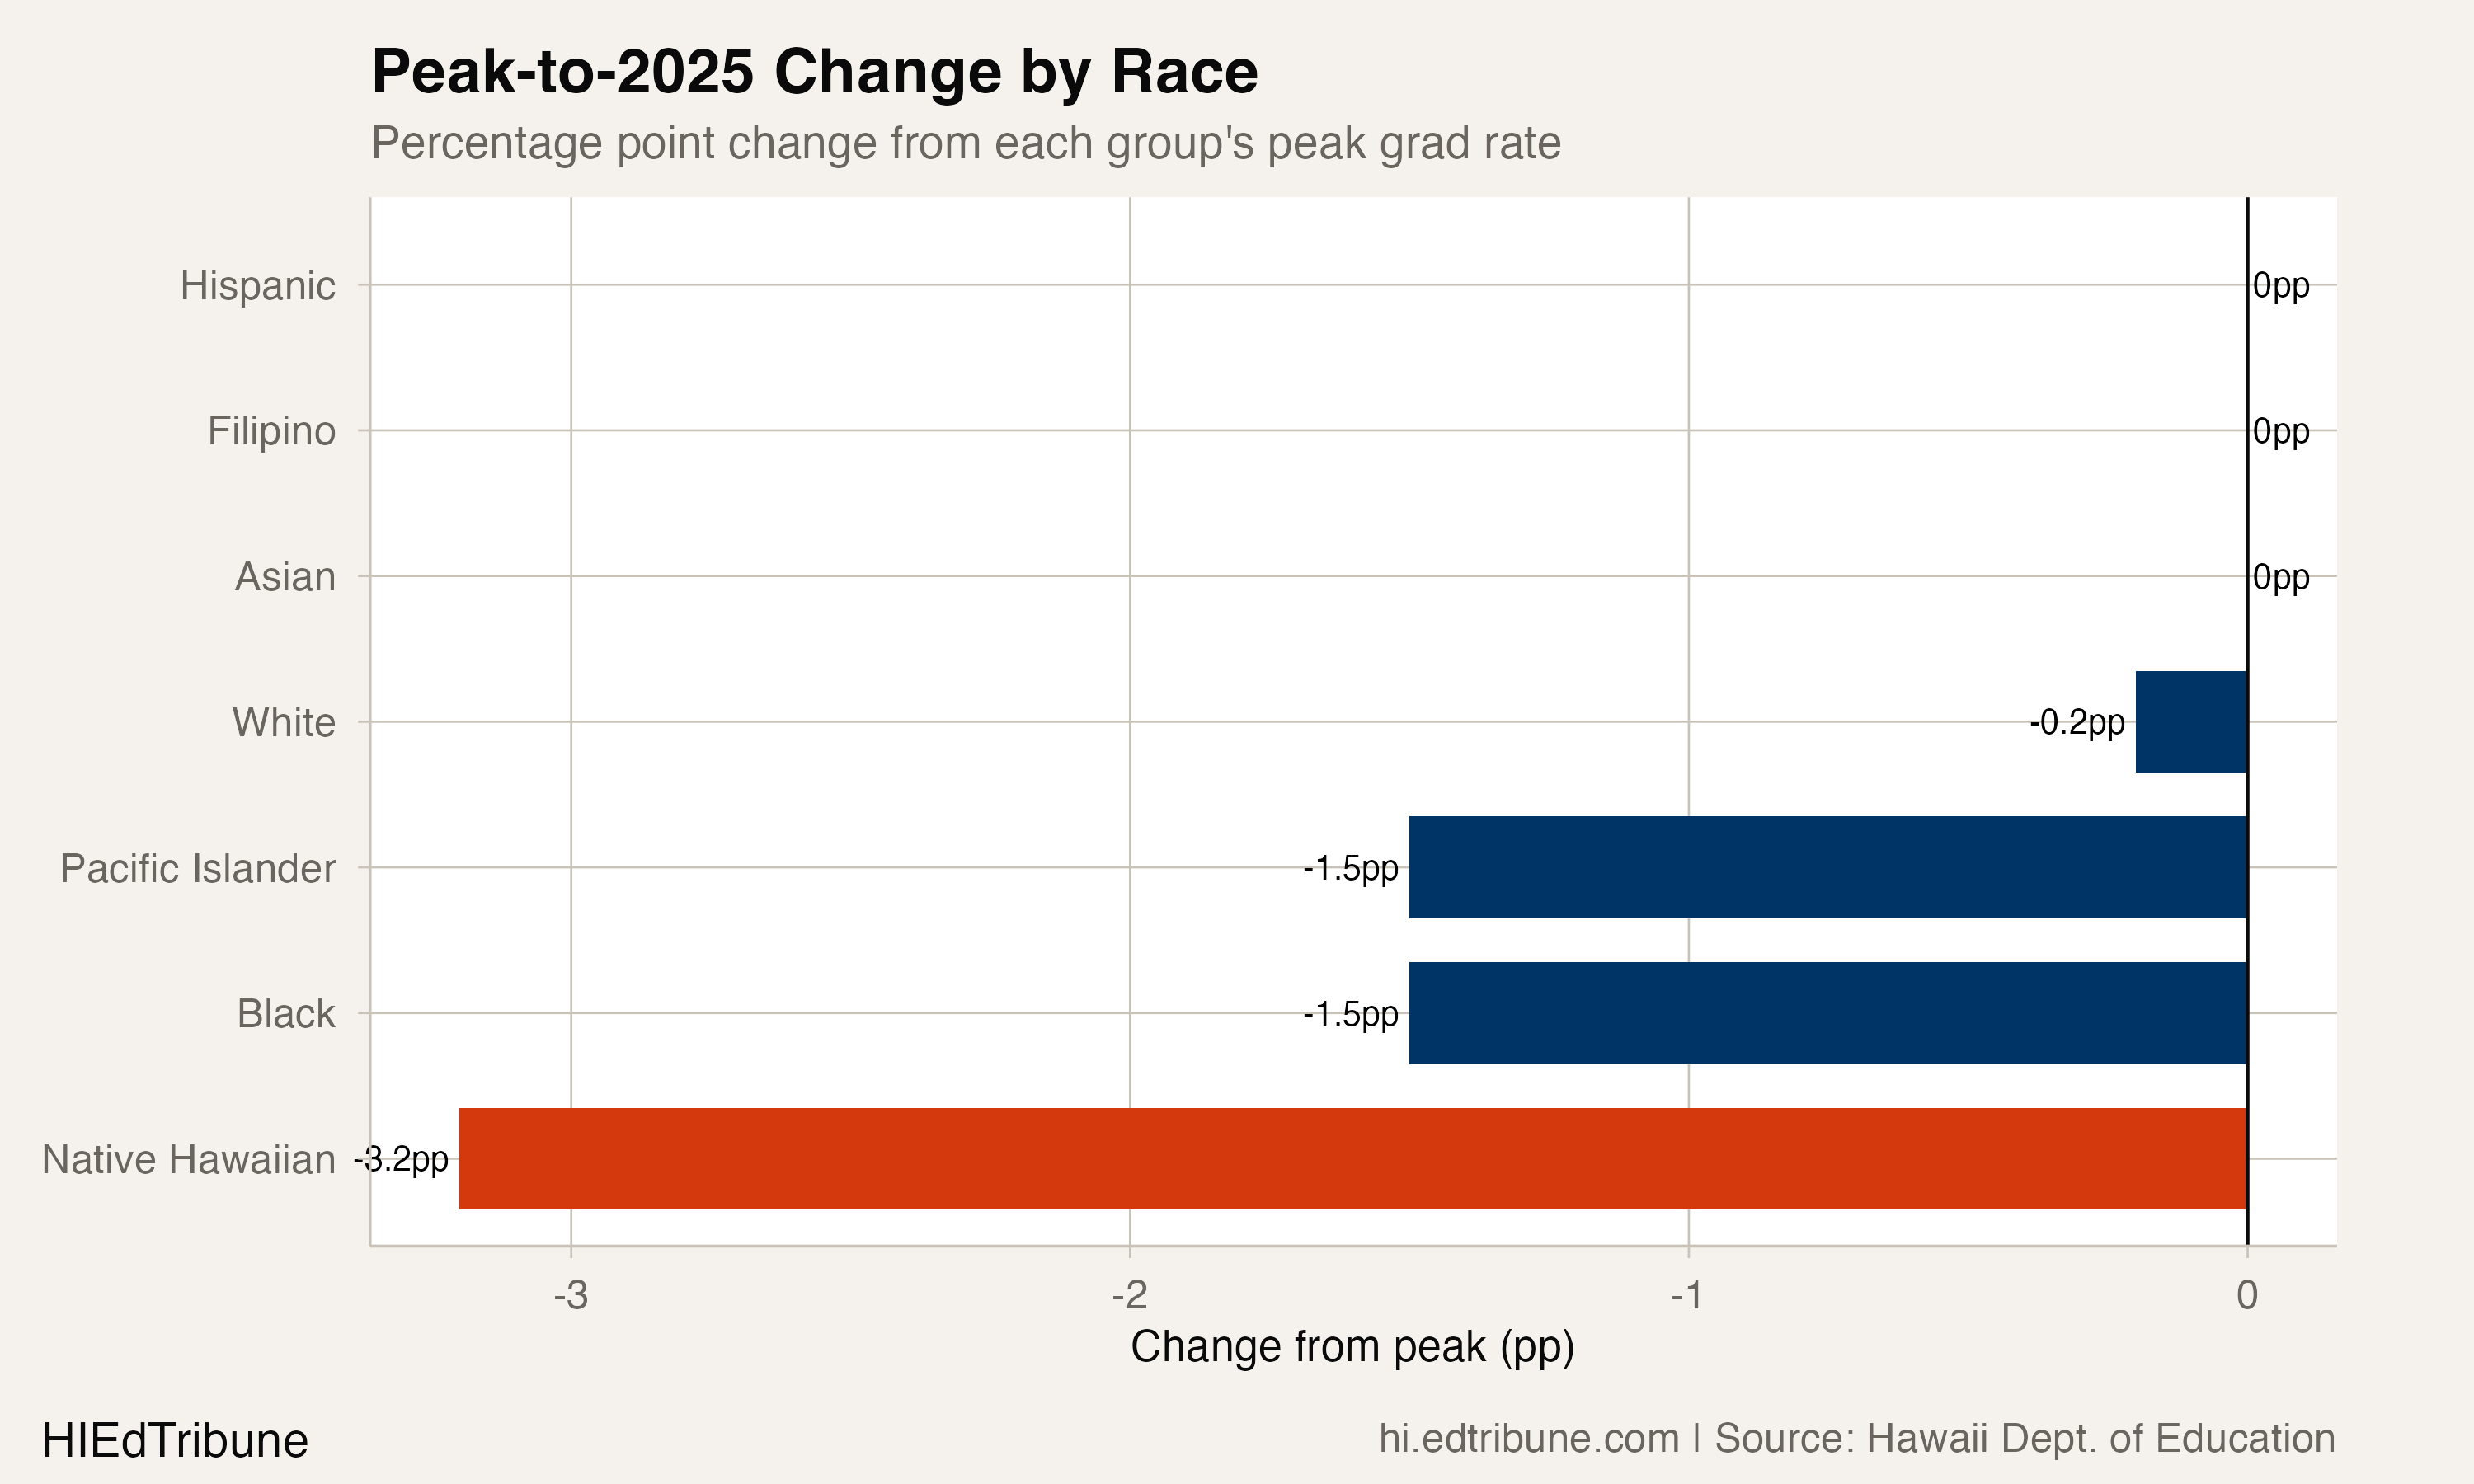
No other racial group fell as far from its own peak. Hispanic students hit an all-time high of 84.8% in 2025, up 10.9 points since 2017. Black students climbed 7.1 points over the same span. Filipino students reached 91.9%. Asian students, 94.3%. Native Hawaiian students gained just 1.6 points across the full nine-year window, among the smallest improvements of any group, and most of that was concentrated between 2017 and 2021. Since then, the trajectory has reversed.
Where the damage is concentrated
The statewide 80.3% masks wide variation across Hawaii's 15 complex areas and charter sector. In the Farrington-Kaiser-Kalani complex area, which covers urban Honolulu neighborhoods from Kalihi to Hawaii Kai, Native Hawaiian students graduated at 72.8% in 2025. That represents a collapse from 82.8% just one year earlier.
Kaimuki-McKinley-Roosevelt, the adjacent urban Honolulu complex area, was nearly as low at 73.2%. At Farrington-Kaiser-Kalani, where Asian students graduated at 95.1%, the gap between Asian and Native Hawaiian students in the same complex area was 22.3 percentage points. At Kaimuki-McKinley-Roosevelt, the Asian-NH gap was 20 points.
Two urban Honolulu complex areas sit among the three lowest for Native Hawaiian graduation; the third is Kailua-Kalaheo, on the windward side, at 73.0%. At the other end, Native Hawaiian students on Kauai graduated at 88.2%. In the Hana-Lahainaluna-Lanai-Molokai complex area, they reached 89.1%, the highest in the state and 3.6 points above the area's overall rate.
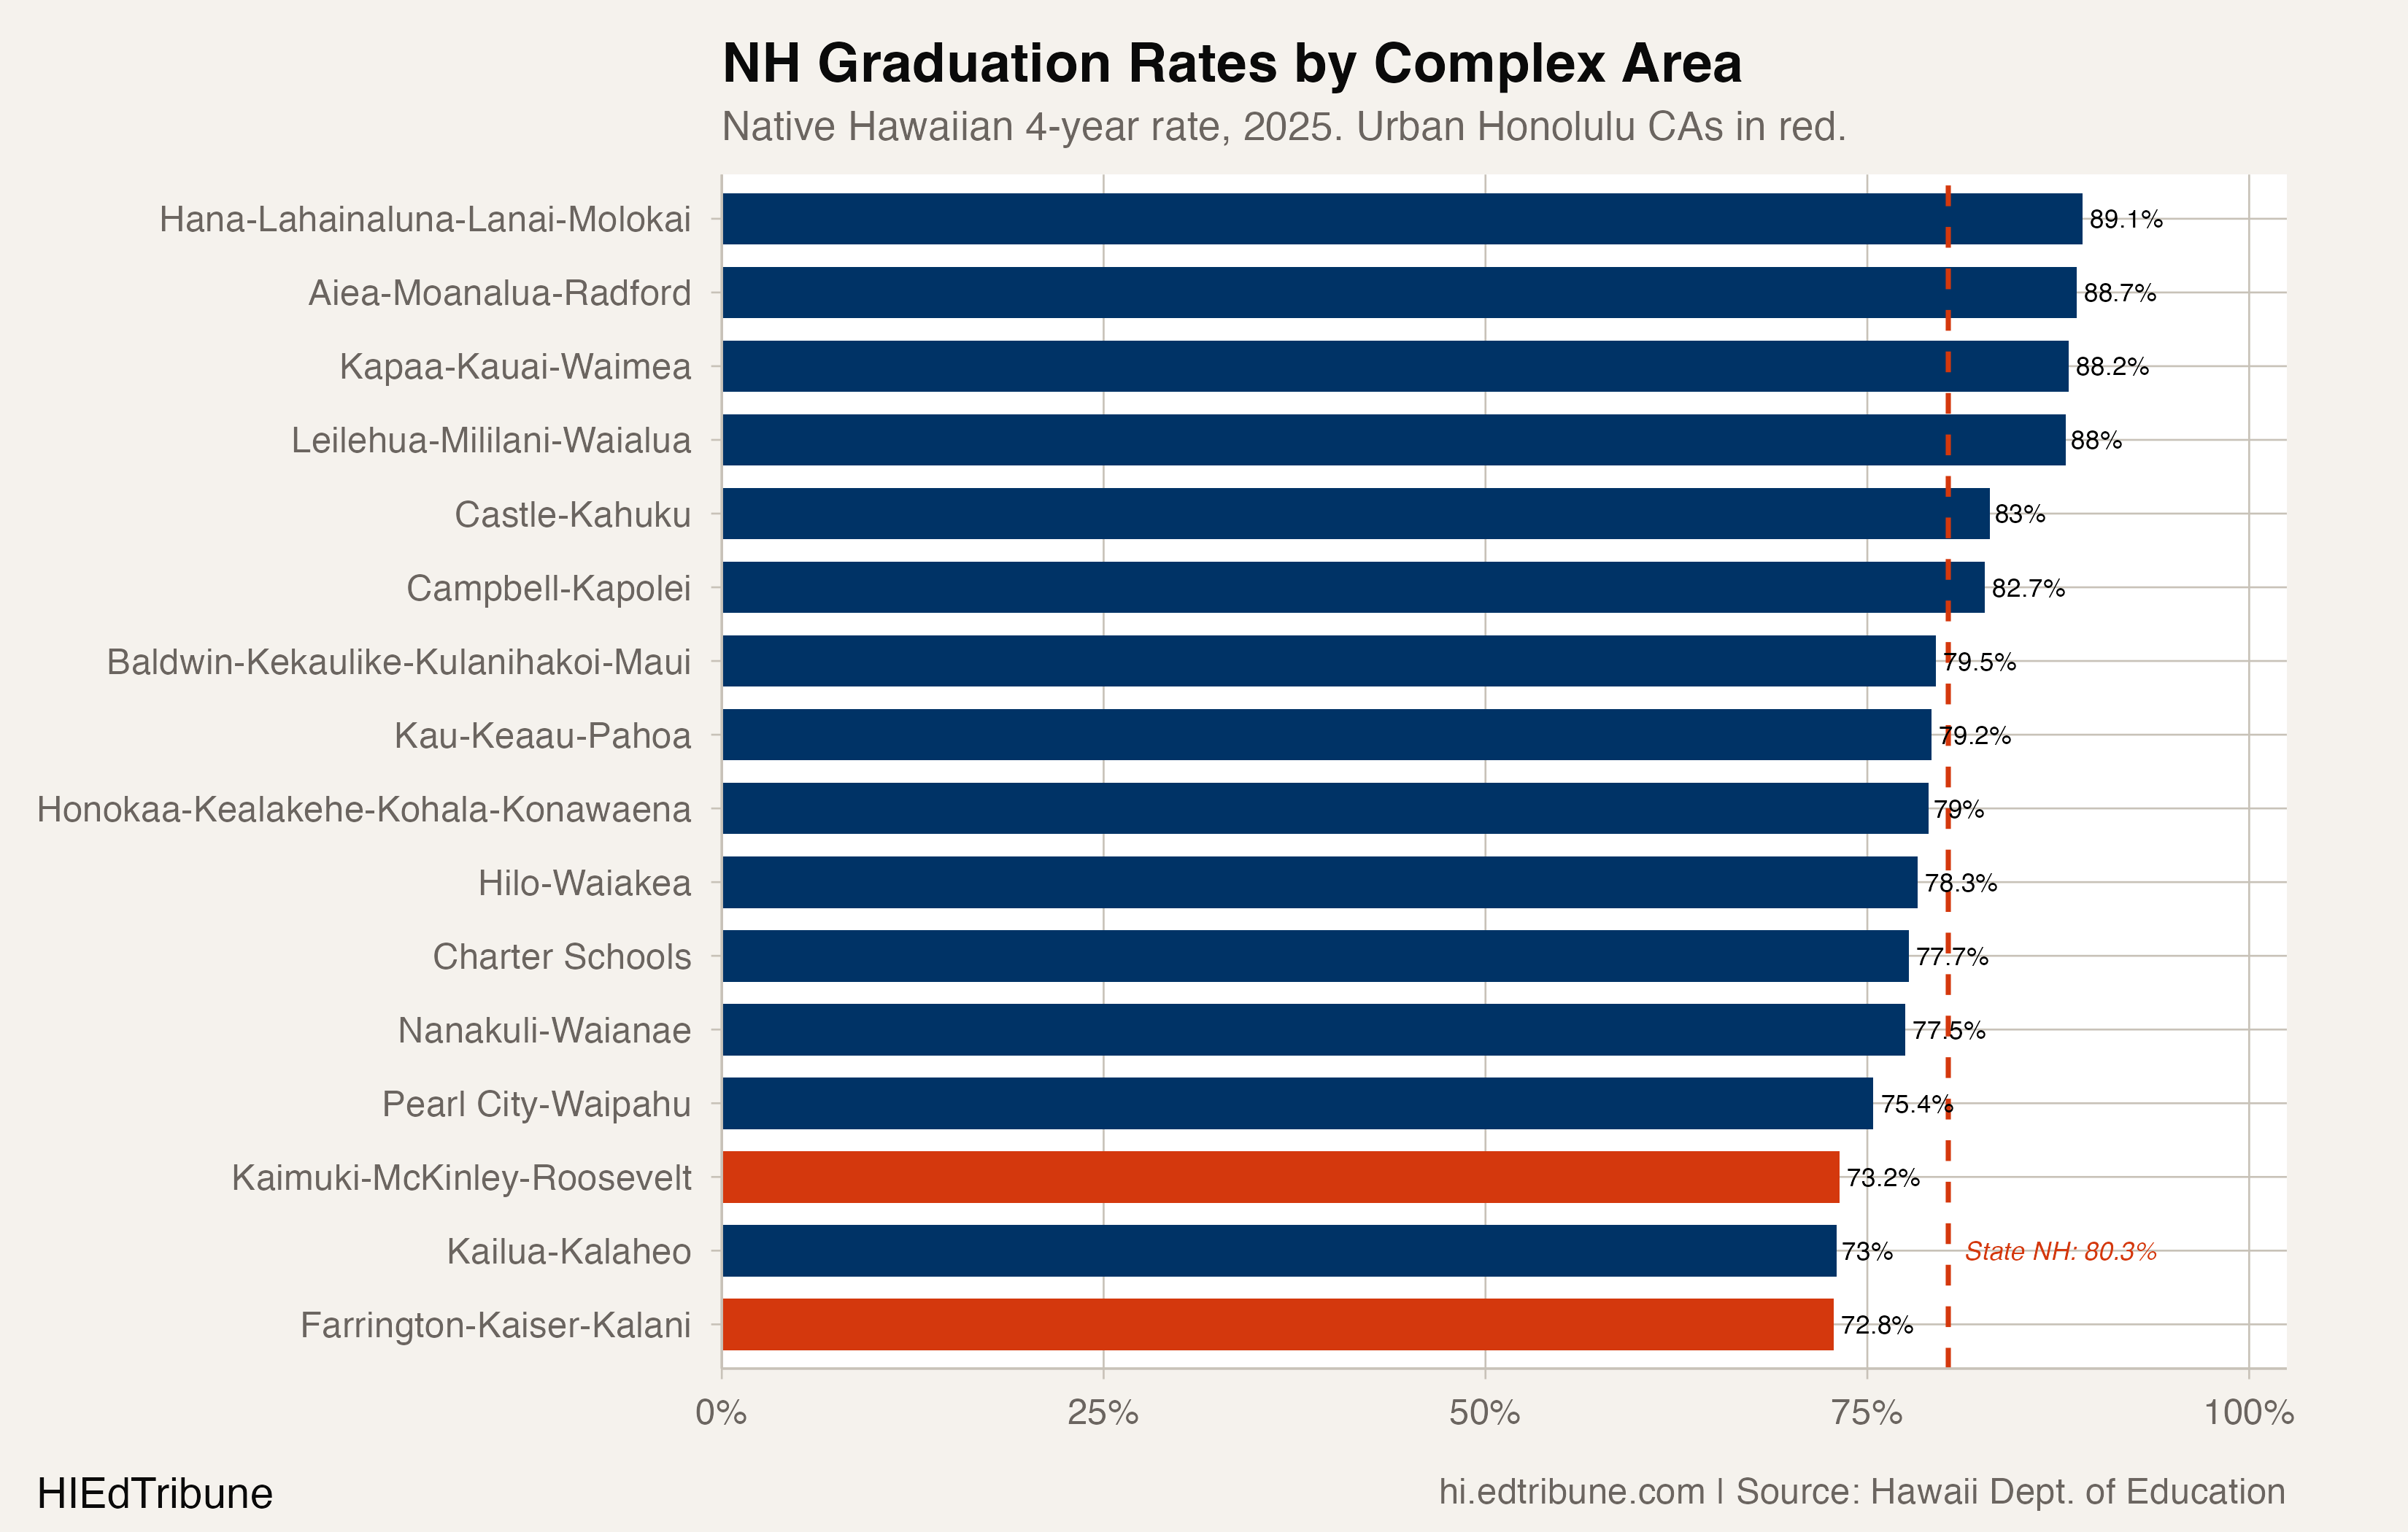
From the lowest complex area to the highest, Native Hawaiian graduation rates span 16.3 points.
The attendance problem underneath
The graduation reversal sits on top of an attendance problem that has fallen hardest on Native Hawaiian and Pacific Islander students. In 2022, 59% of Native Hawaiian and Pacific Islander students were chronically absent, missing 10% or more of school days, compared with 39% of all Hawaii students, according to the Kids Count figures Civil Beat reported.
Later years are harder to compare. Hawaii's own published measure counted students absent 15 or more days through 2022-23 and counts students absent 18 or more days from 2023-24, so rates from before and after that change cannot be set side by side, and the Kids Count figure uses a third definition.
Native Hawaiian students in the Nanakuli-Waianae complex area graduated at 77.5% in 2025.
Attendance there has long been a concern. In 2018, Honolulu Magazine reported that about one-third of students in the area had been chronically absent in each of the two previous school years, and that it counted 571 students who were homeless.
"The student not coming to school doesn't happen just because the students just don't come to school. We look at attendance as a symptom of something much larger." -- Brad Asakura, a counselor at Keonepoko Elementary, in Honolulu Magazine, 2018
The same article reported that in the Ka'u-Kea'au-Pahoa complex area on Hawaii Island, 20% to 40% of students switched schools each year as families moved for work, housing, or other reasons. That kind of mobility fractures academic continuity in ways that accumulate by senior year.
A widening gap in a recovering state
What makes this reversal especially striking is the context. Hawaii has been a national leader in post-pandemic academic recovery, ranking second among states in reading recovery and fourth in math recovery between 2019 and 2024.
The state overall graduation rate, at 85.8%, is within half a point of its all-time high. Recovery, in aggregate, is happening.
But that recovery is not reaching Native Hawaiian students at the same rate. In 2025, the state overall rate ticked up 0.1 percentage points. Native Hawaiian students fell 2.3 points, their largest one-year decline in the data. That 2.4-point divergence in a single year widened the gap to its largest on record.
The state received over $600 million in pandemic-era federal funding, with the final obligation occurring in September 2024. That money funded universal screening three times annually, expanded tutoring, and summer learning at 222 of the state's 296 public schools. Whether those interventions reached the students whose rates are now falling, or whether the end of that federal funding creates a new cliff, is the open question.
The reversal without a visible cause
The graduation rate data from HIDOE provides rates only, not cohort counts. That means it is impossible to know whether the 2025 decline represents more Native Hawaiian students dropping out, more entering the pipeline with academic deficits from pandemic-era absenteeism, or a compositional change in who is being counted. The class of 2025 entered high school in fall 2021, at the peak of pandemic disruption to attendance patterns.
The geography does not settle it. Two of the three lowest Native Hawaiian rates are in urban Honolulu, and some of the highest are on Kauai and in Hana-Lahainaluna-Lanai-Molokai. But Native Hawaiian rates were also low in Hilo-Waiakea (78.3%), Kau-Keaau-Pahoa (79.2%), and Baldwin-Kekaulike-Kulanihakoi-Maui (79.5%). The data alone cannot connect the pattern to housing, attendance, or anything else.
Meanwhile, Hawaii faces a projected 33% drop in high school graduates by 2041, the steepest projected decline in the nation. A proposed bill (SB 2541) would establish a commission to review school facilities and report recommendations on consolidation by fall 2027.
The 5.5-point gap between Native Hawaiian students and the state average is the widest in the data. Whether it continues to widen, or whether a new cohort begins to close it, depends on decisions being made now about where resources go and whether recovery means everyone recovers.
Detailed code that reproduces the analysis and figures in this article is available exclusively to EdTribune subscribers.
Discussion
Sign in to join the discussion.
Loading comments...