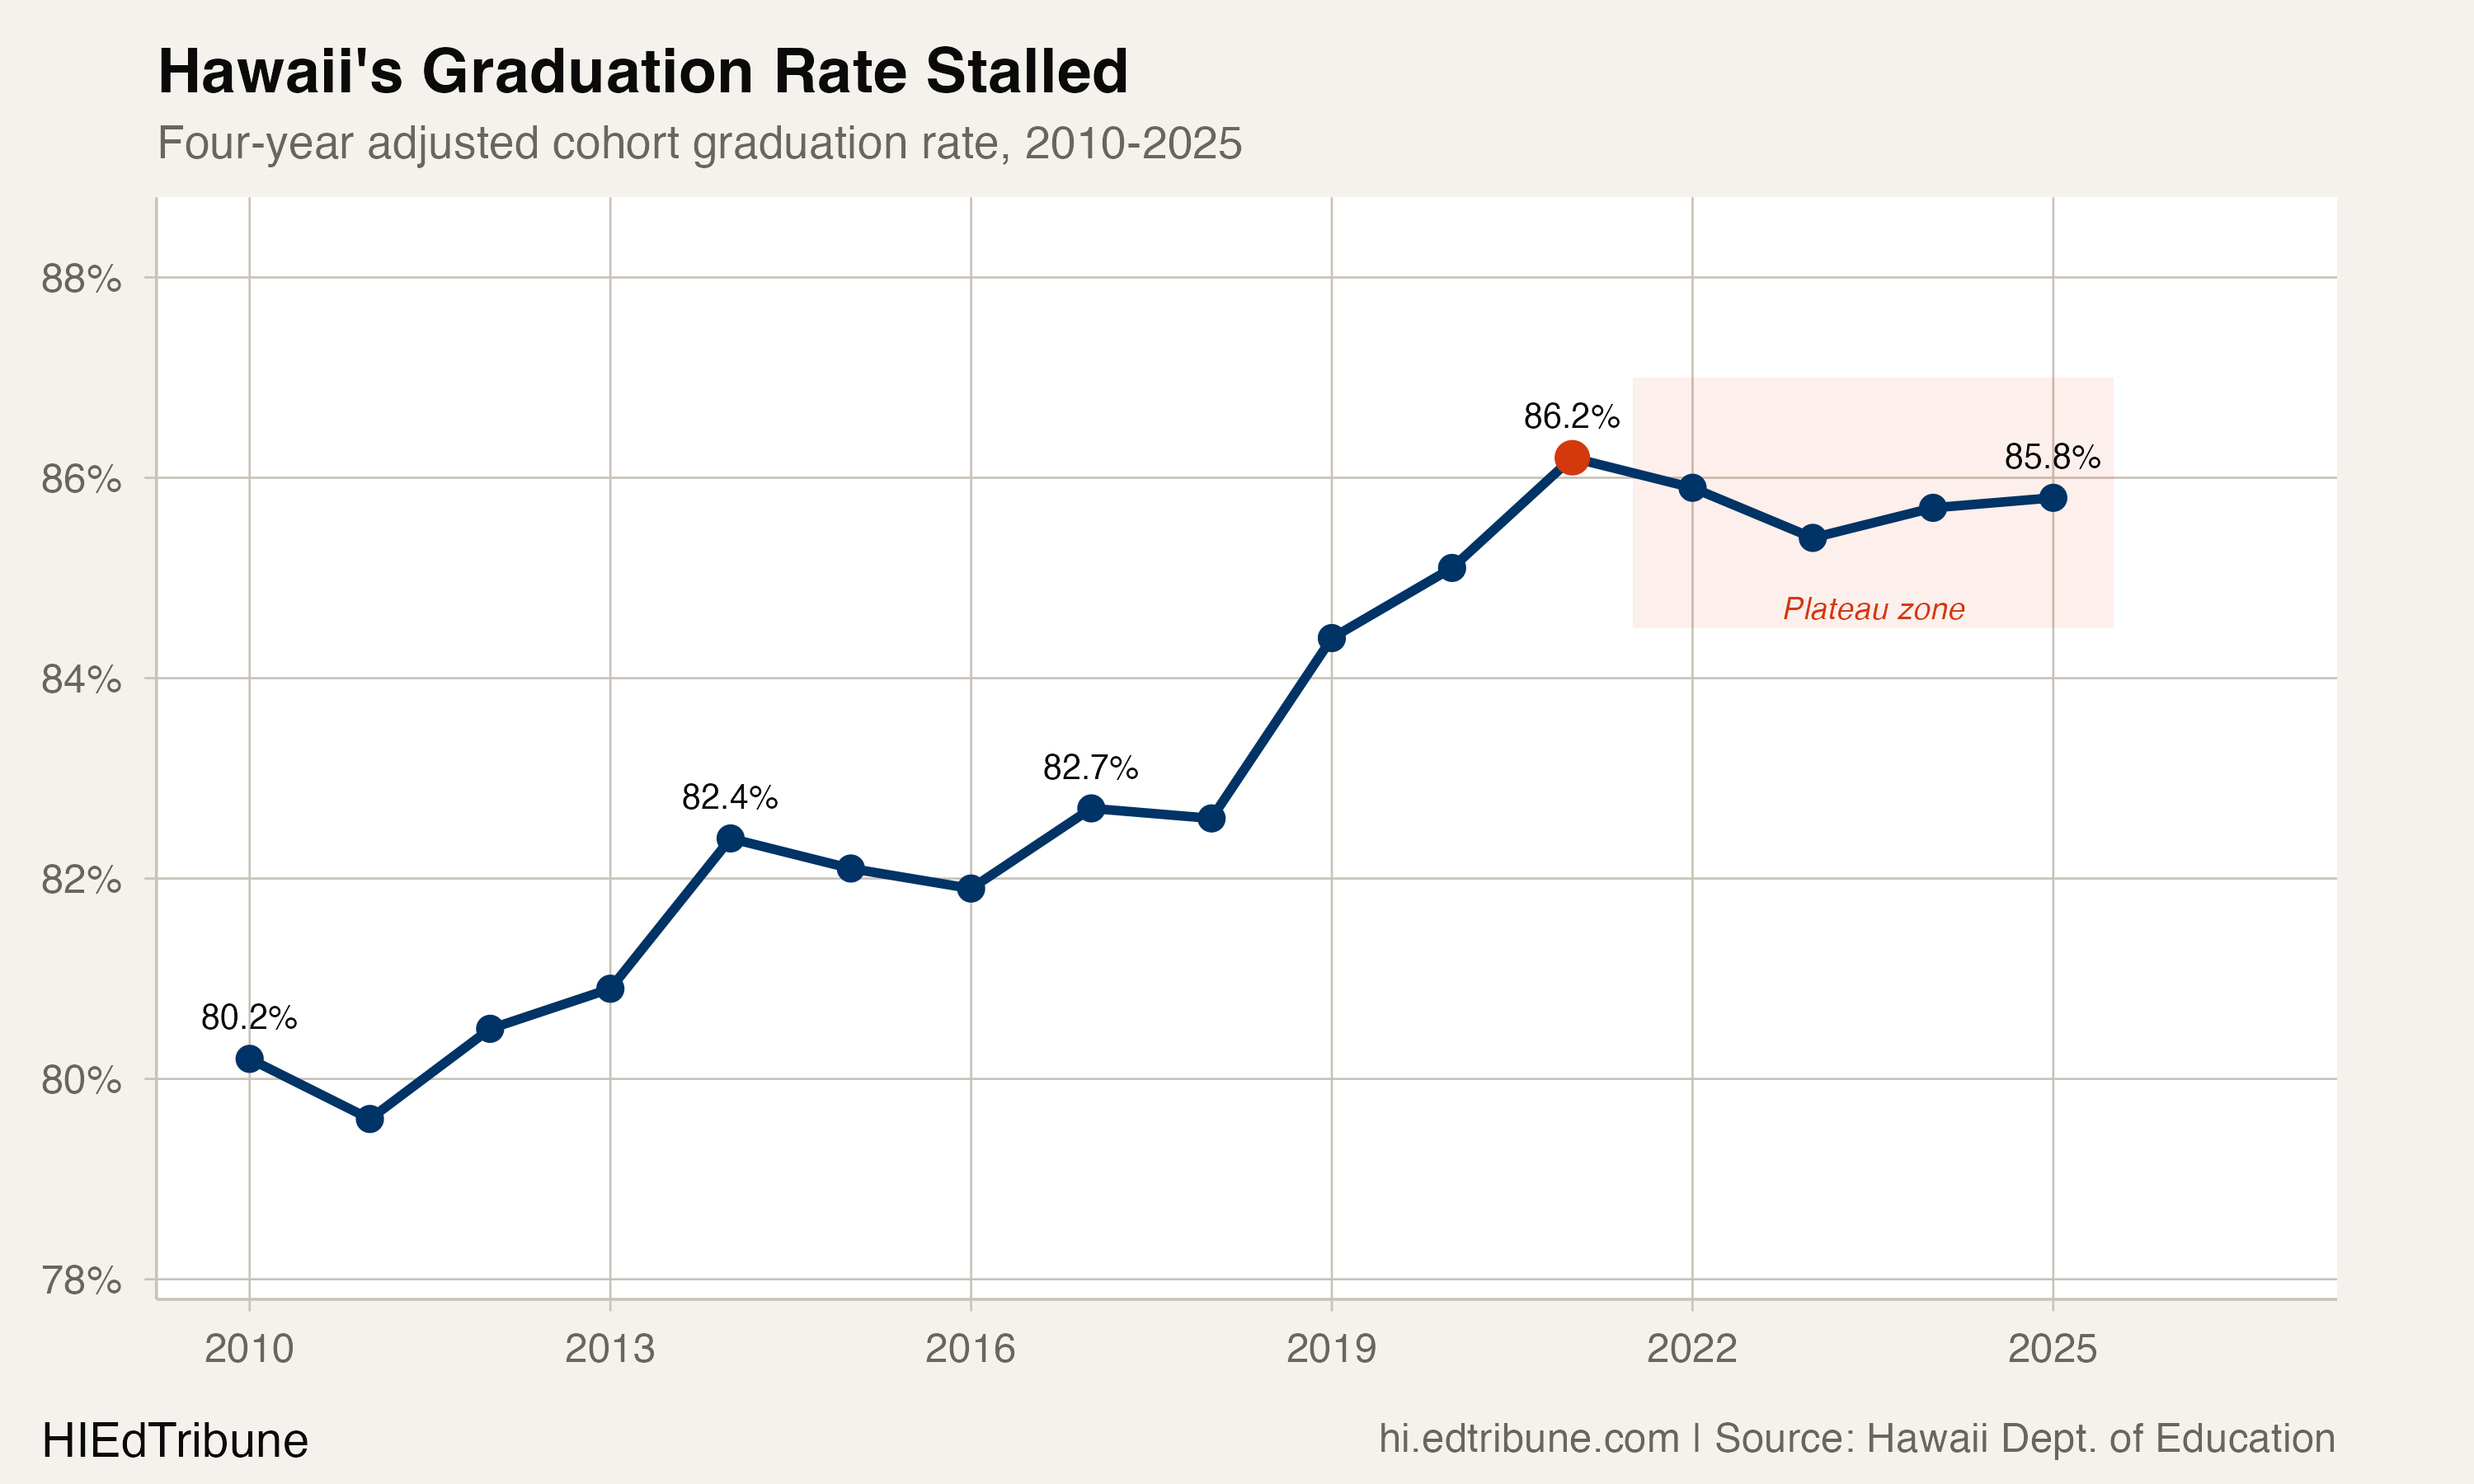
In 2021, Hawaii posted an 86.2% four-year graduation rate, the highest in state history. It felt like momentum. A decade of steady gains had lifted the rate six full points from 80.2%, averaging more than half a percentage point per year. At that pace, 90% was within reach by the late 2020s.
Four years later, the rate is 85.8%. The gain over that entire span is zero. The standard deviation of the four annual readings since the peak is 0.22 percentage points, a range so tight it is indistinguishable from statistical noise. The climb did not slow down. It stopped.
The shape of a ceiling
The trajectory breaks cleanly into two eras. From 2010 through 2021, the state gained 6.0 percentage points, with the strongest years coming in a late surge: +1.8 points in 2019, +0.7 in 2020, +1.1 in 2021. Then the line went flat. The four years since the peak have produced readings of 85.9%, 85.4%, 85.7%, and 85.8%, a total range of half a point.
The year-over-year changes make the deceleration starker. The three years leading into the peak averaged +1.2 points annually. The three years after averaged -0.2. The most recent year, 2025, added just 0.1 points, a gain so small that rounding could erase it.
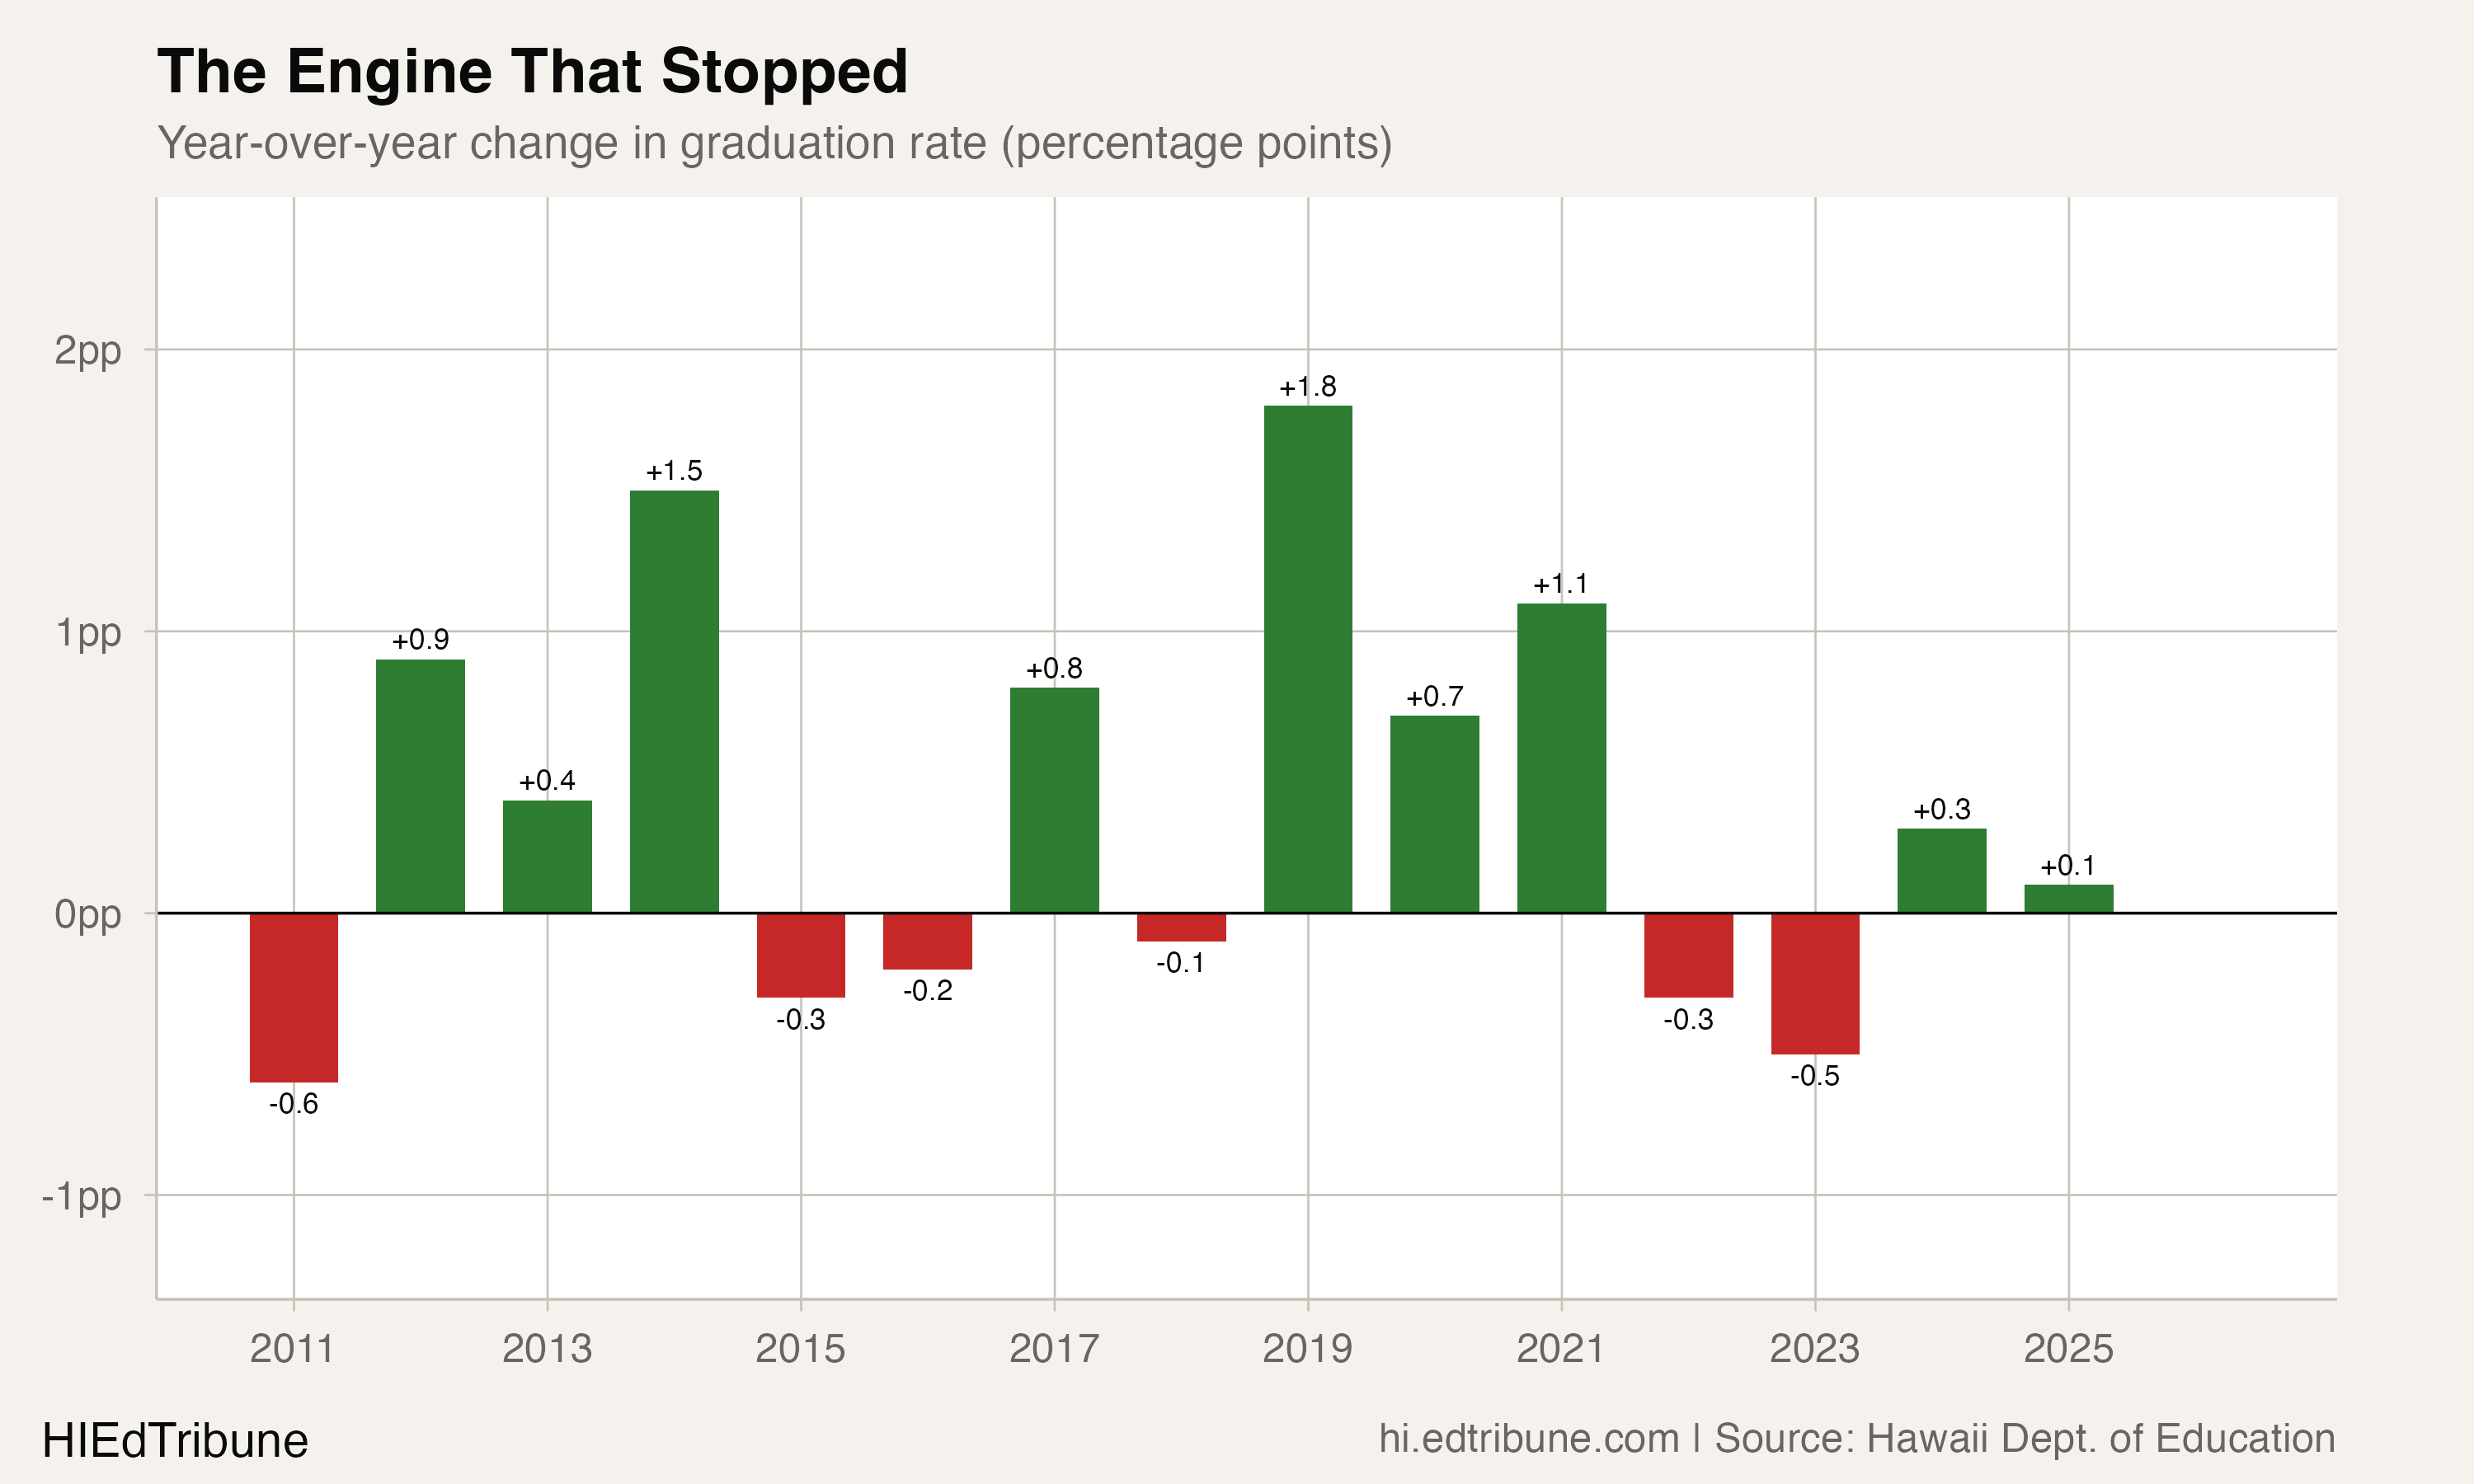
This is not a decline. It is something harder to fix: a system that has absorbed its available gains and found no new ones.
On the Leeward Coast, a different math
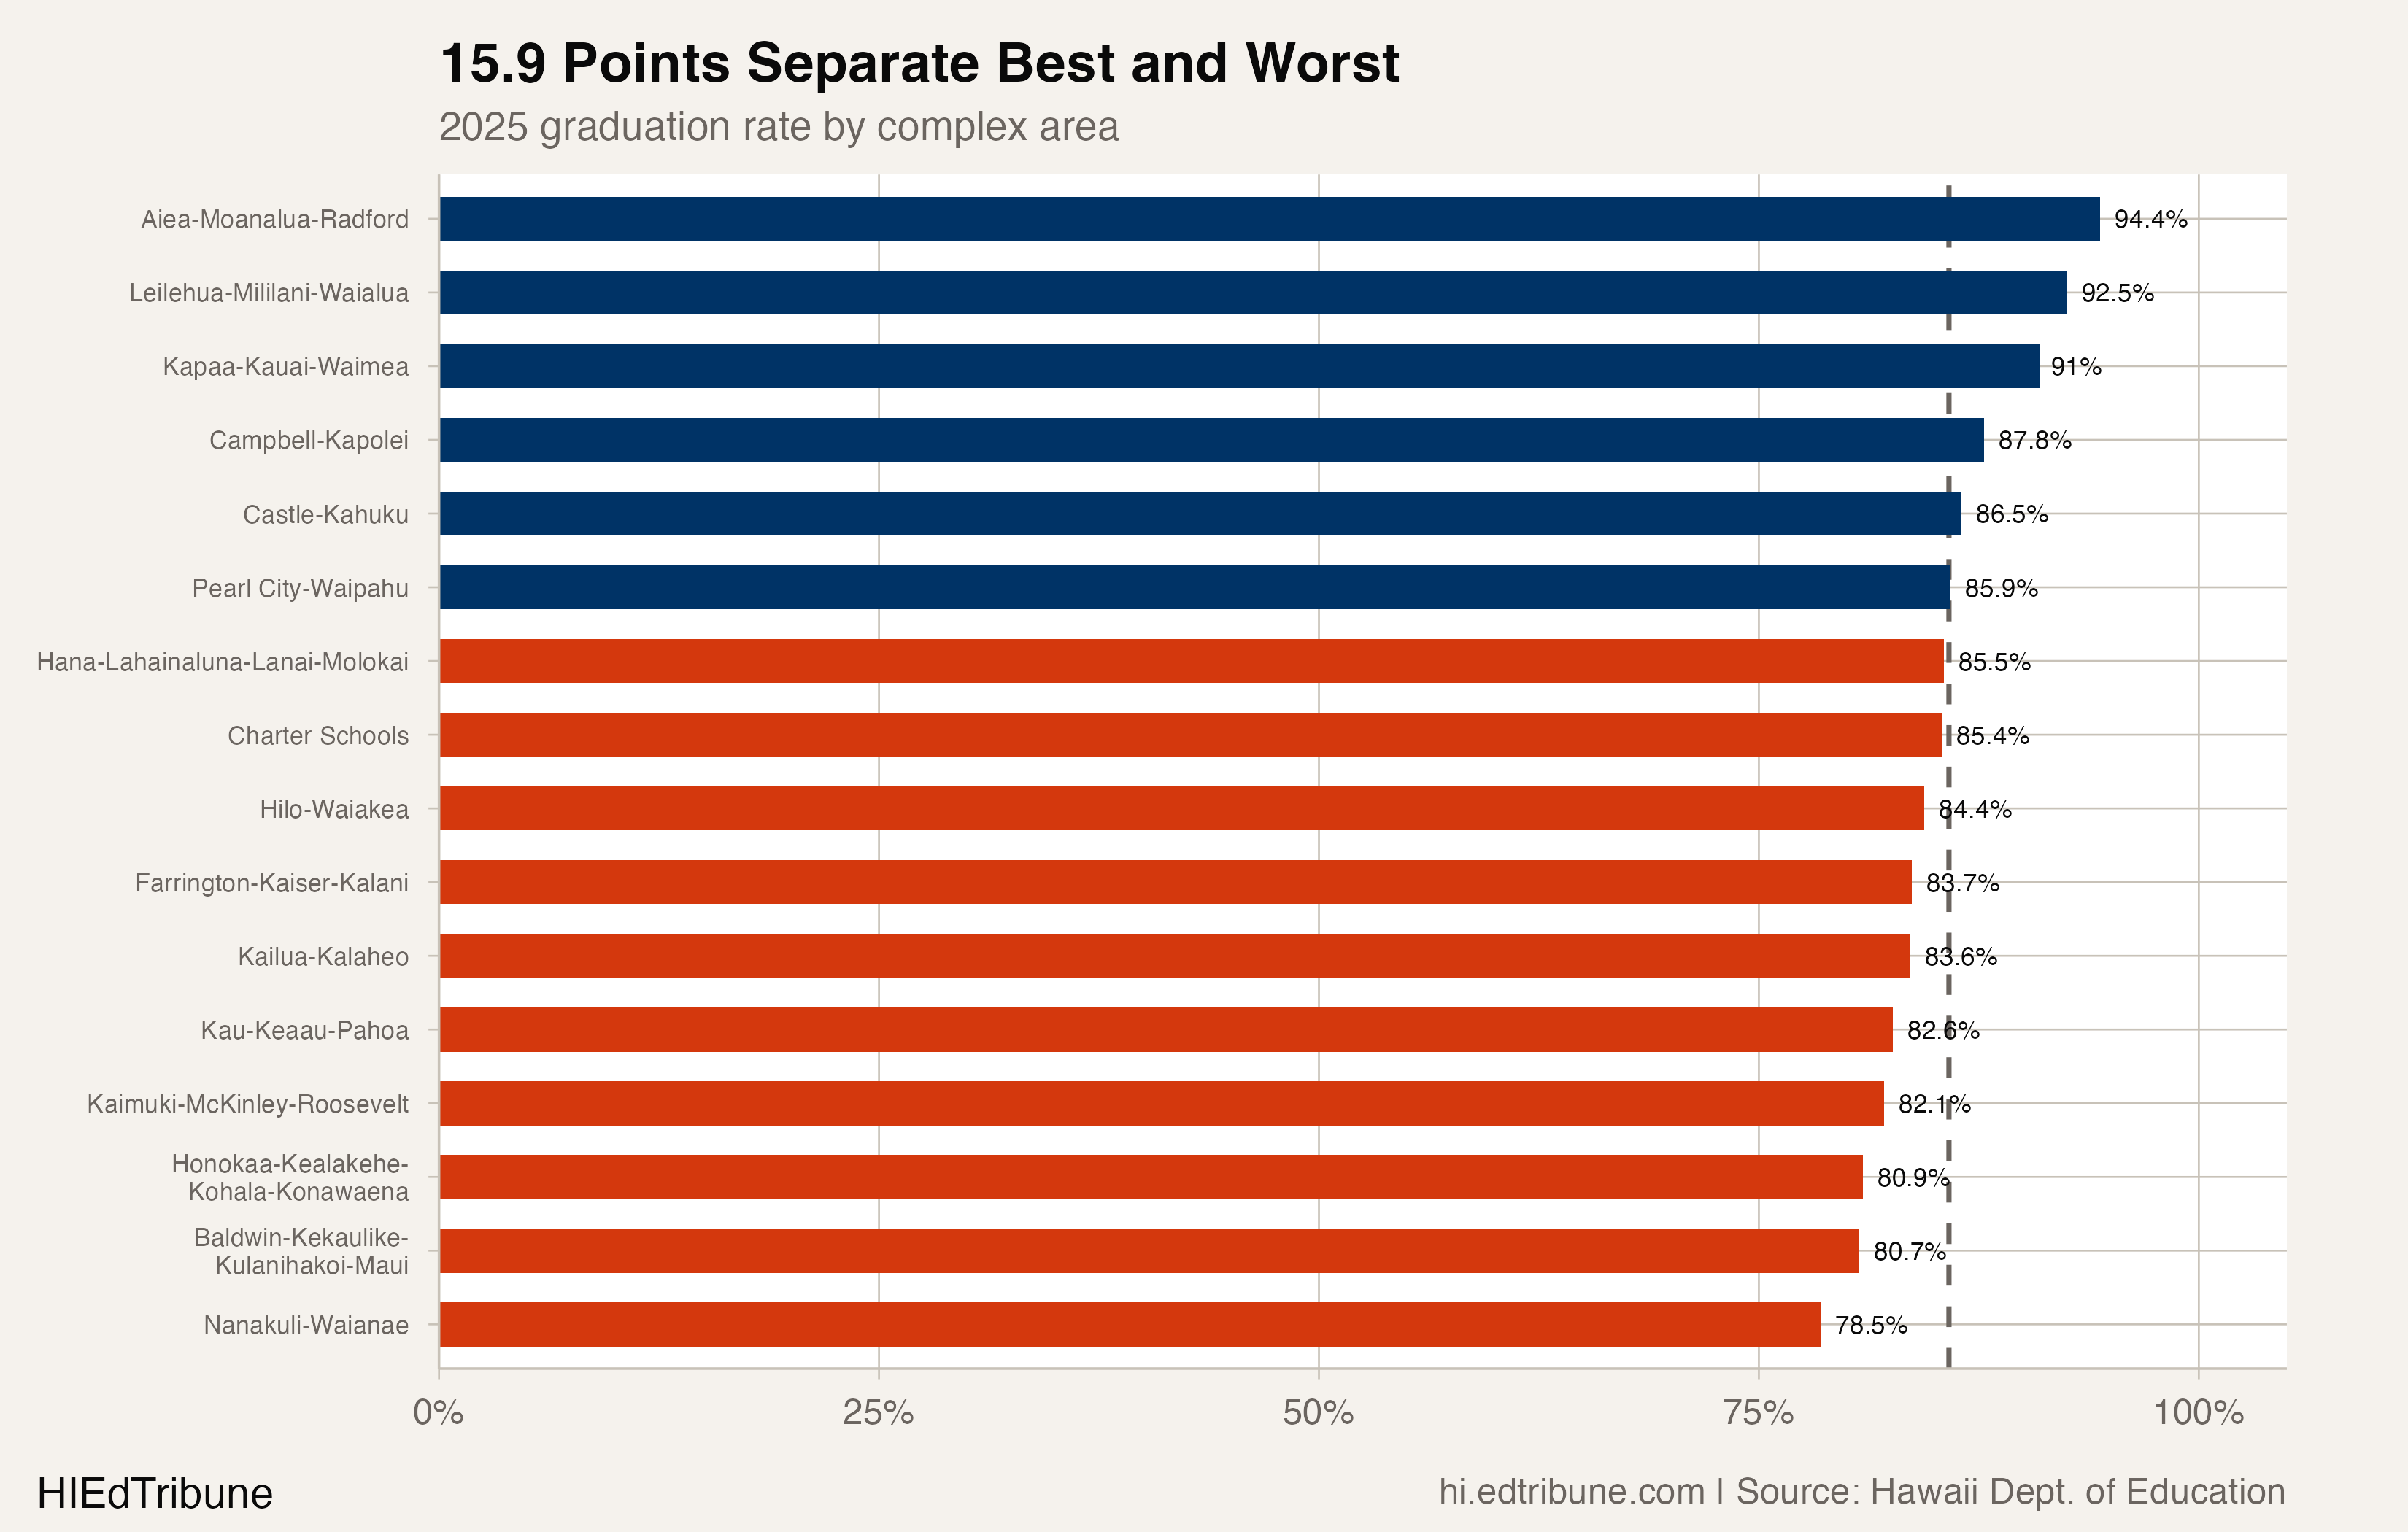
Statewide averages obscure what is happening on the ground in places like Nanakuli and Waianae, on Oahu's western shore. The Nanakuli-Waianae complex area graduated 78.5% of its students in 2025. That is 15.4 points higher than its 2010 rate of 63.1%, the single largest gain of any complex area in the state. It is also the only complex area below 80%.
Nanakuli-Waianae peaked at 82.0% in 2022 and has declined in each of the three years since. Farrington High School, which serves Kalihi, one of Honolulu's most economically disadvantaged neighborhoods, graduated 72.5% of its students in 2025, essentially unchanged from its 72.1% rate five years ago.
At the other end, the Aiea-Moanalua-Radford complex area on central Oahu posted 94.4%, its highest mark in the 16-year dataset. Three complex areas now exceed 90%. The 15.9-point spread between the top and bottom is not a new problem, but the plateau has frozen it in place.
Who the plateau leaves behind
The statewide average conceals a 25.9-point gap between the highest-performing and lowest-performing racial groups. Asian students graduate at 94.3%, Filipino students at 91.9%. Pacific Islander students graduate at 68.4%, a rate closer to the national average for students with disabilities than to the state's overall mark.
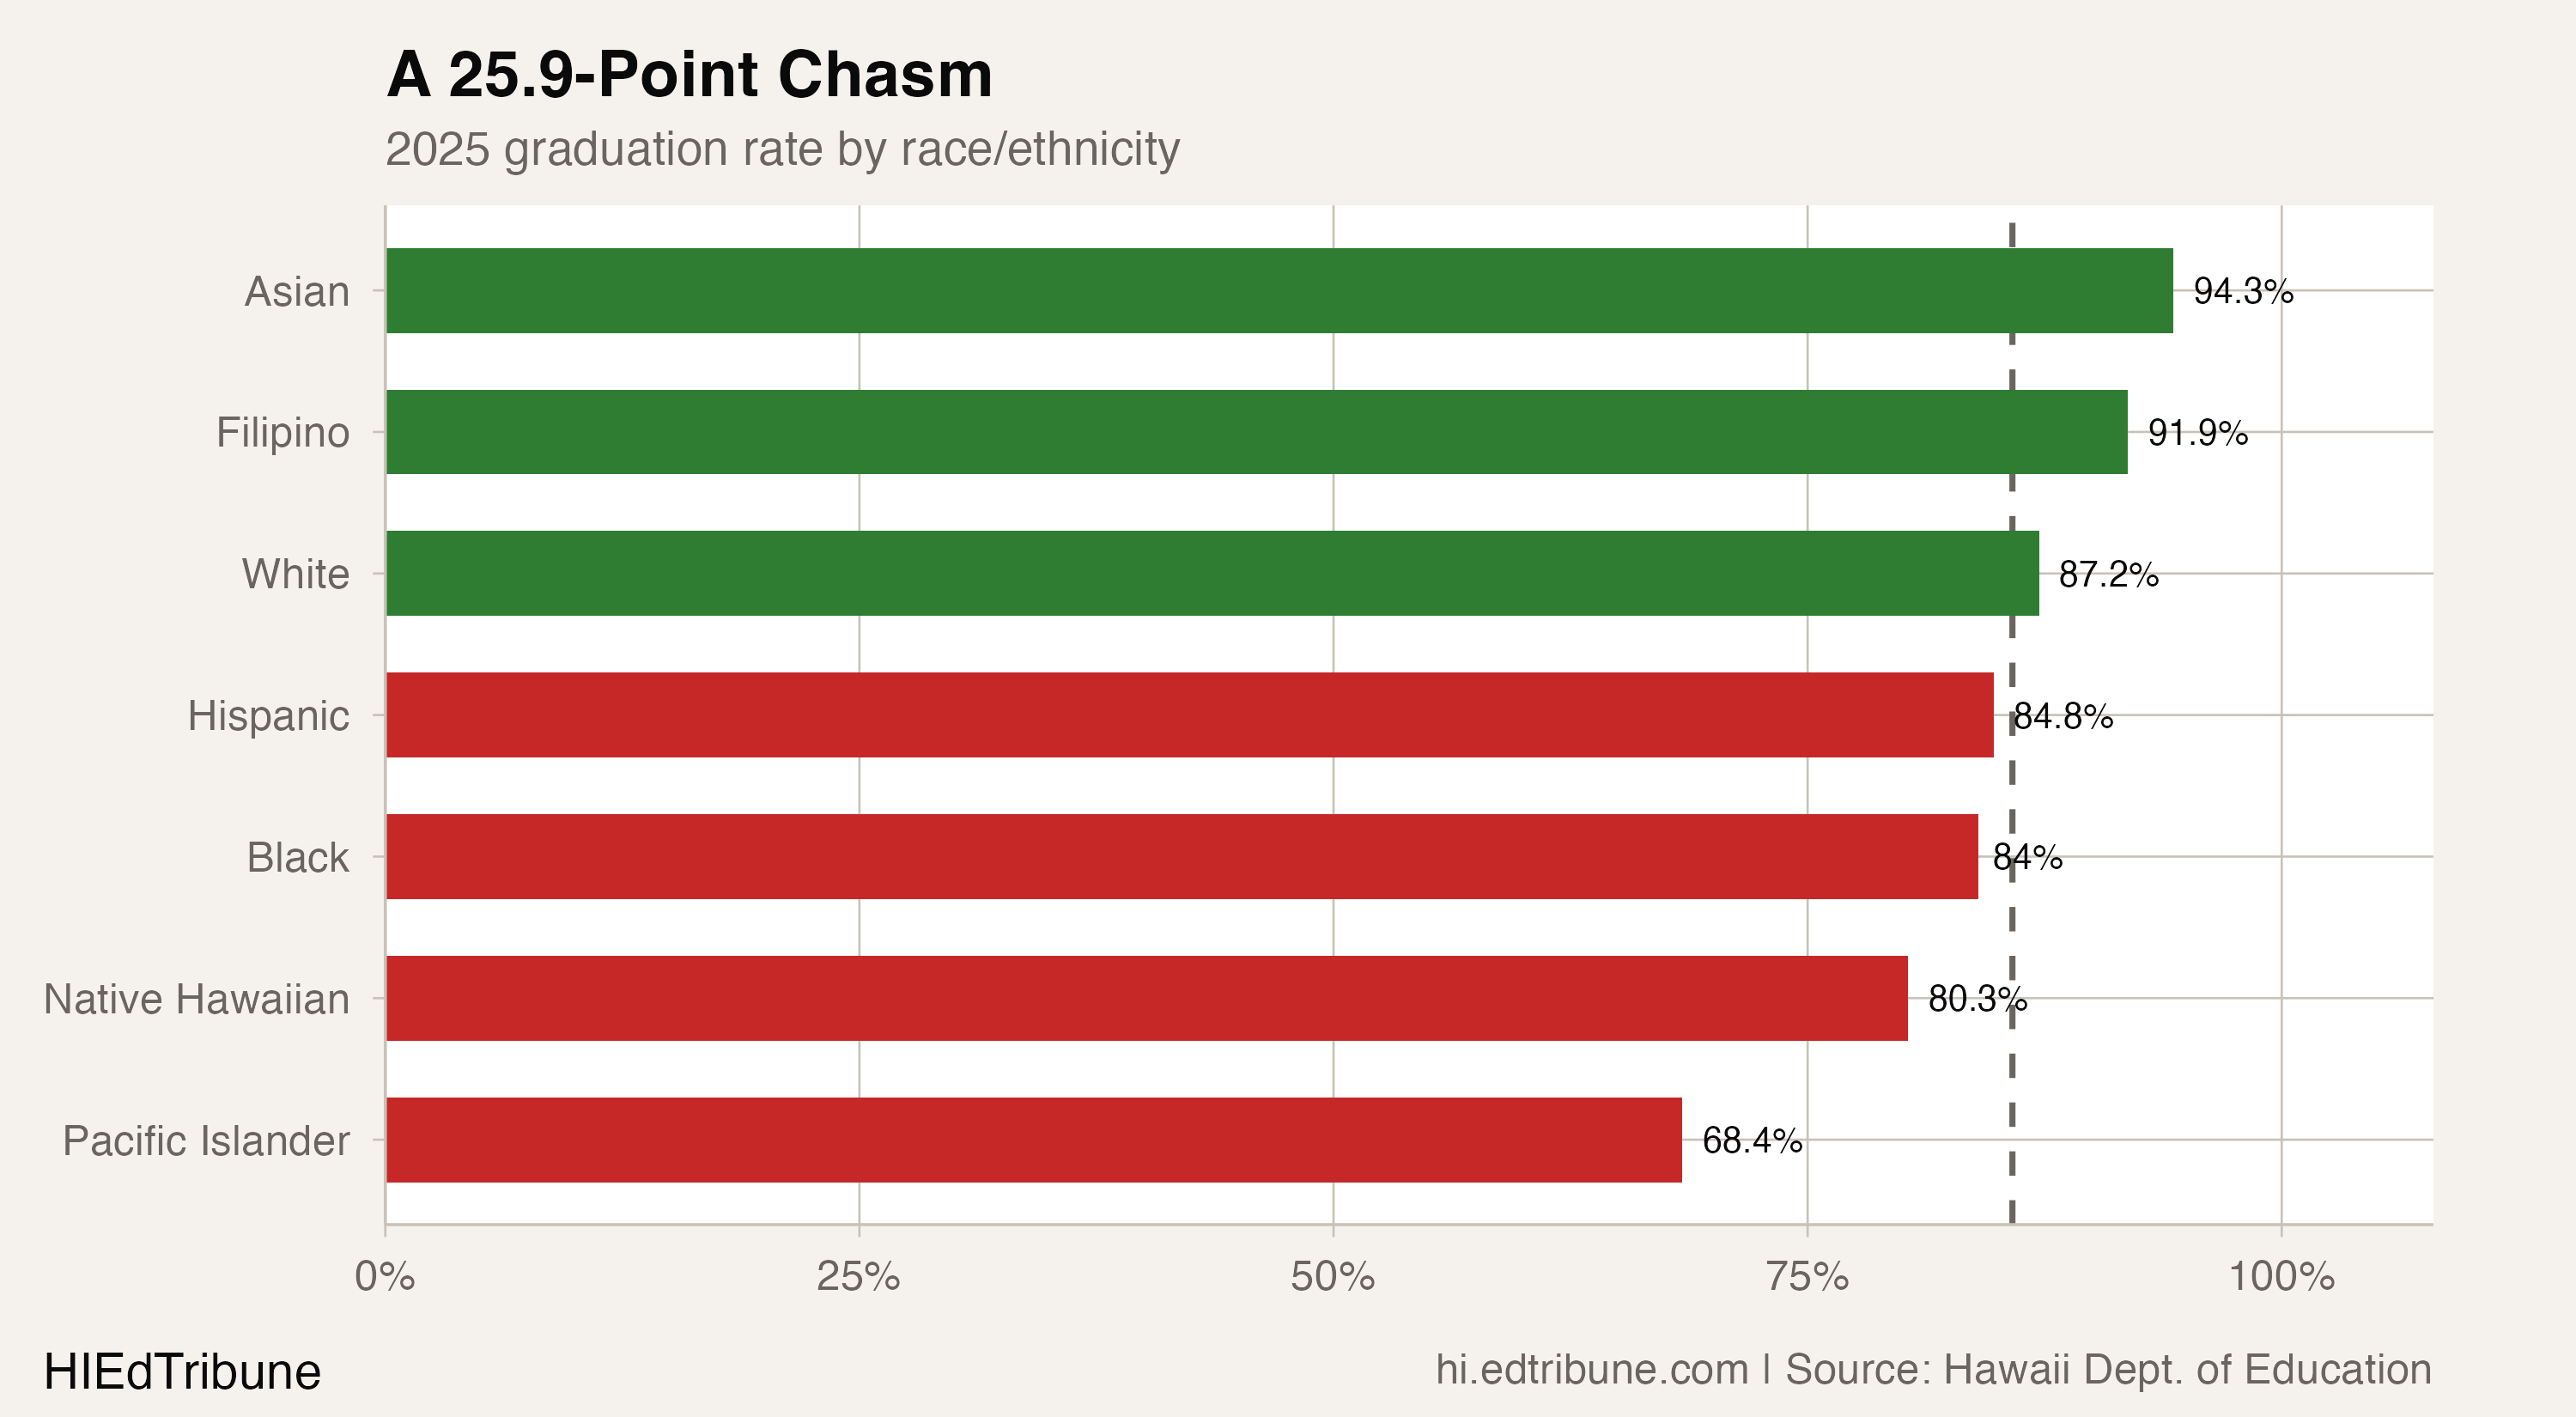
That 68.4% figure represents a group that has never broken 70% in the nine years of available race data. The Pacific Islander rate has oscillated between 63.8% and 69.9% since 2017, with no sustained trajectory in either direction. Research from the University of Hawaii documented that only 50% of Micronesian students who started high school between 2013 and 2018 graduated, more than a third below the state average. COFA-nation students, many of whom arrive as English learners from the Marshall Islands, Chuuk, and Pohnpei, face compounding barriers: language, chronic absence, and what researchers described as systemic discrimination.
"There's system problems happening. For example, in our graduation rates for students from Micronesia." Brook Chapman de Sousa, University of Hawaii, Hawaii Public Radio, May 2022
The state does not disaggregate Pacific Islander into Micronesian, Samoan, Tongan, and other subgroups in its graduation data, making it impossible to track whether interventions are reaching the students with the largest gaps.
Native Hawaiian graduation rates are moving backward
Perhaps the most concerning signal is the reversal for Native Hawaiian students. From 2017 through 2021, Native Hawaiian graduation rates climbed from 78.7% to 83.5%, narrowing the gap with the state average to 2.7 points. That progress has been erased. The 2025 rate fell to 80.3%, and the gap has doubled to 5.5 points.
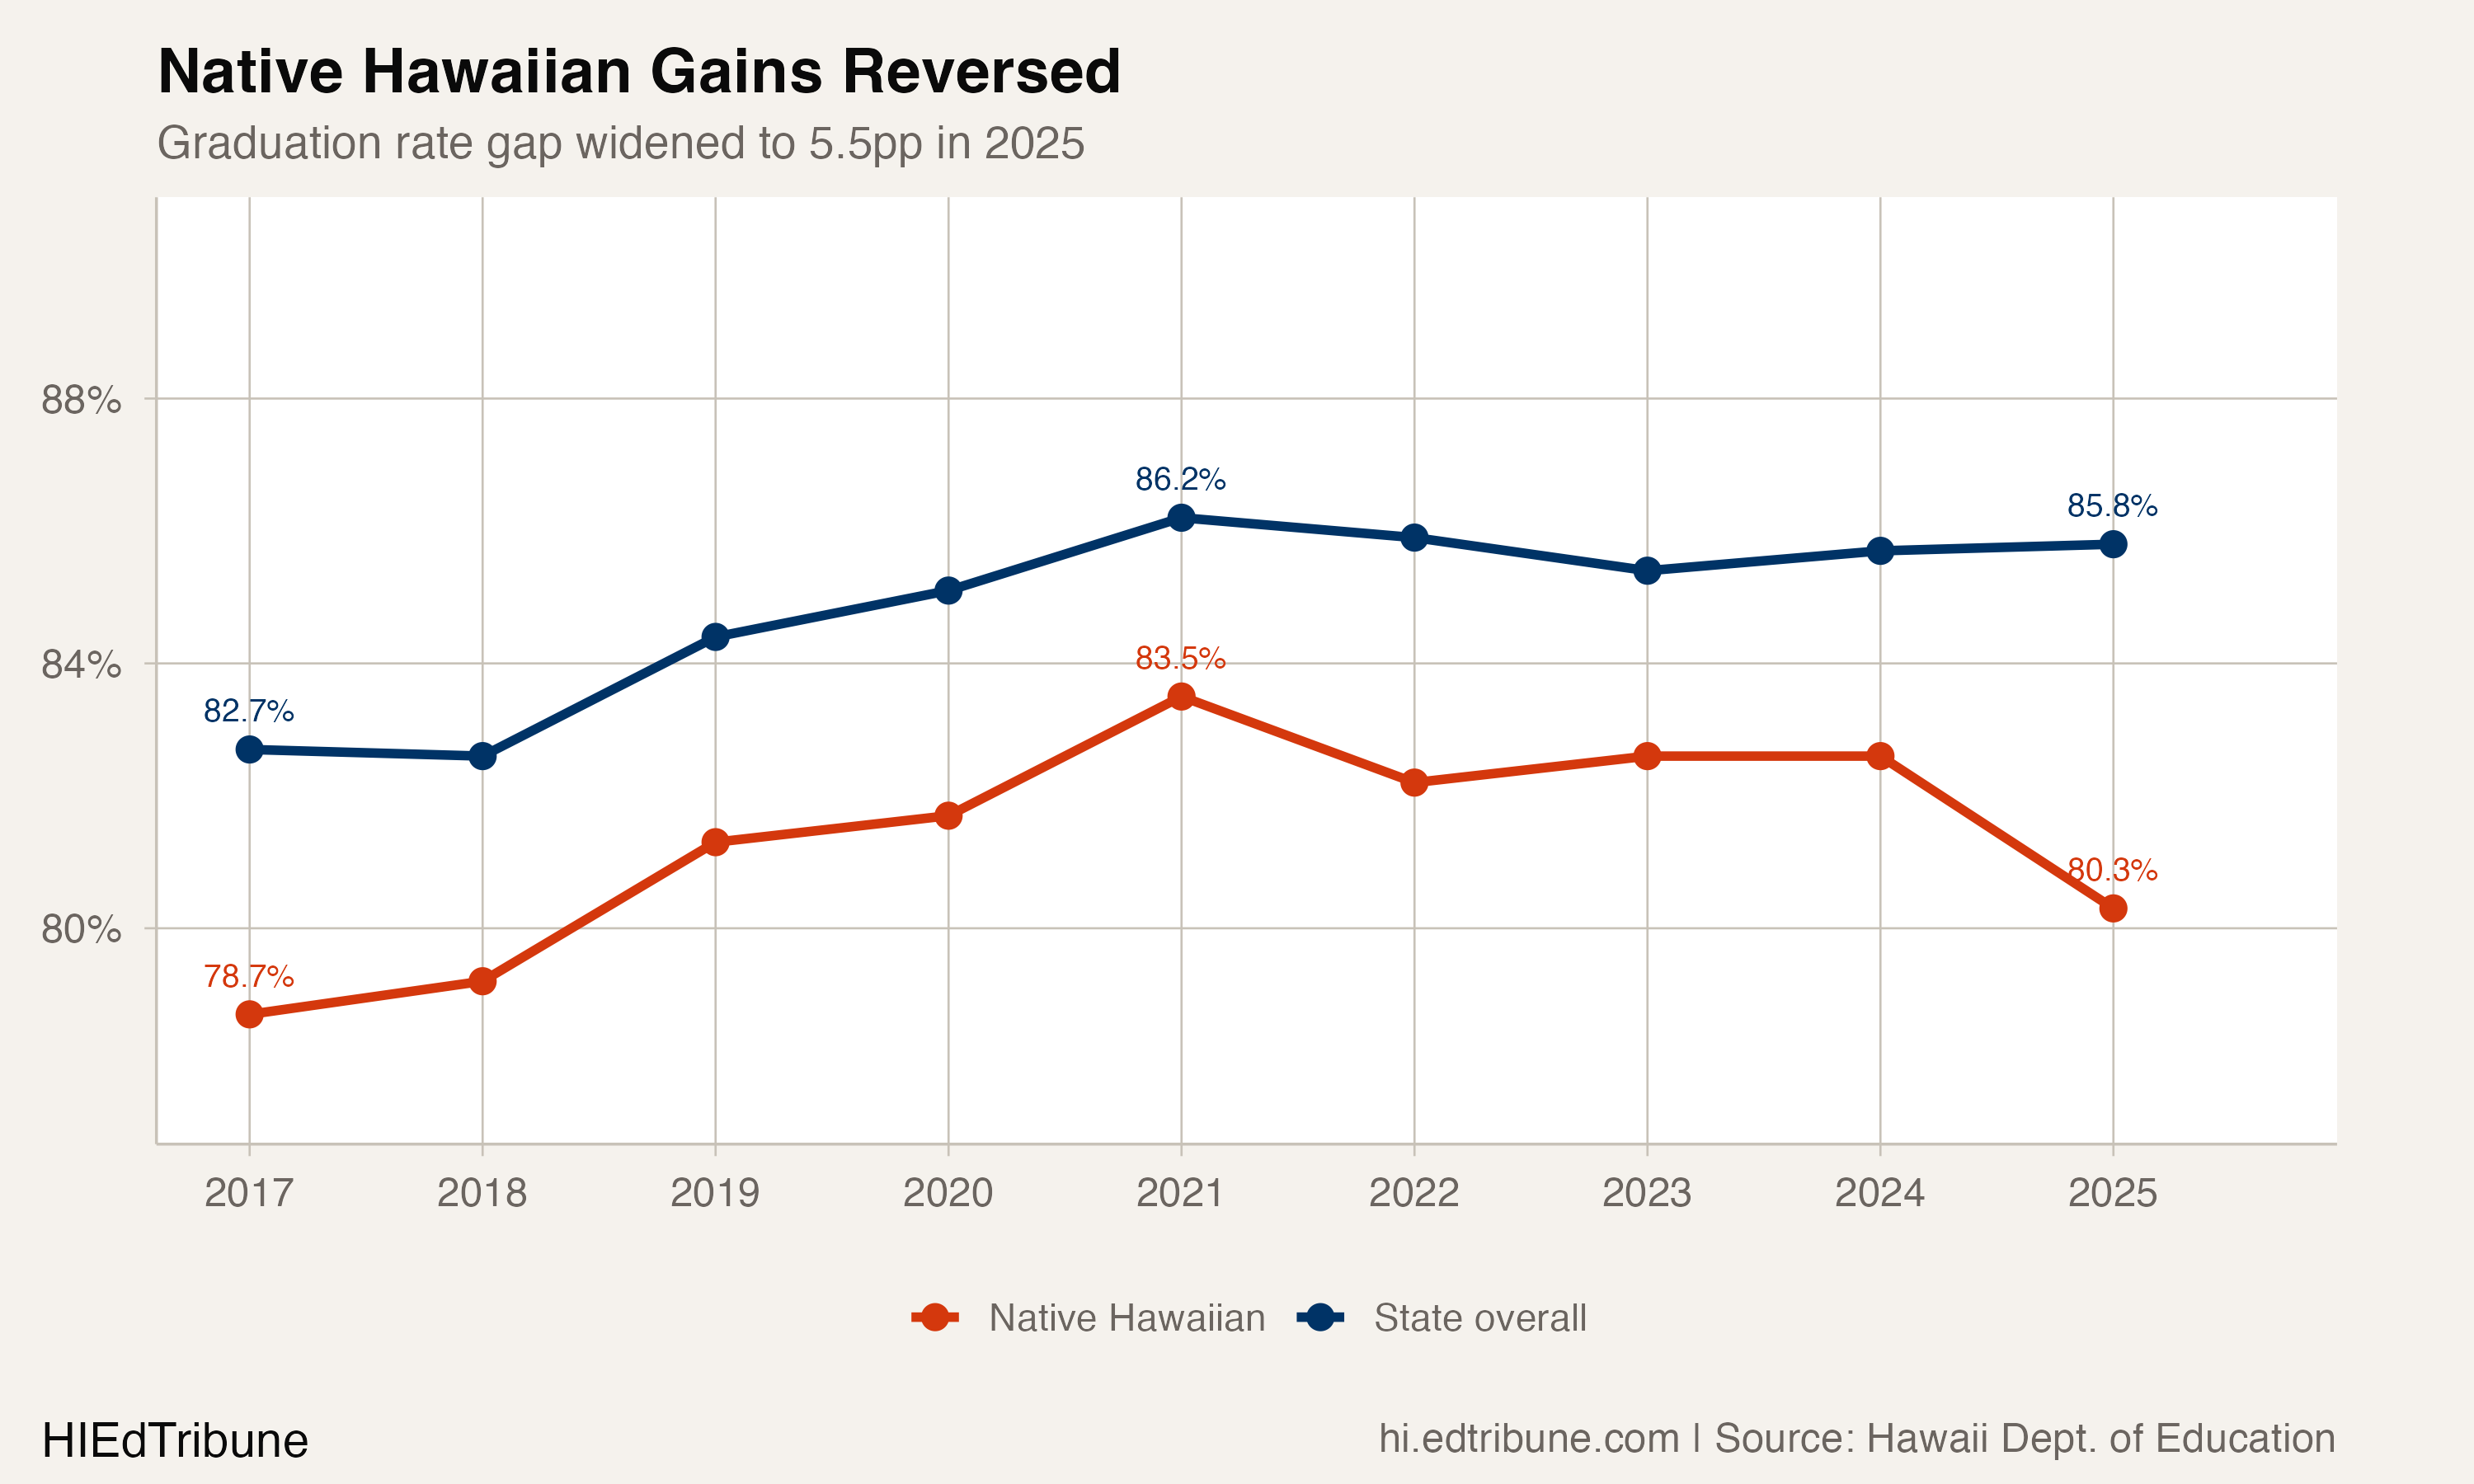
Native Hawaiians are the largest single racial group in the public school system. A 3.2-point decline for this population is not a rounding error. It represents hundreds of students who would have graduated under the trajectory established in the late 2010s but did not. The post-pandemic recovery that the state's overall rate appears to reflect has not materialized for Native Hawaiian students.
What may explain the stall
The most plausible structural explanation is that the initial decade of gains came from readily available interventions: credit recovery programs, expanded summer school, dropout re-engagement, and improved data tracking. These tools push graduation rates up from the 70s and low 80s. They become less effective as the remaining non-completers are students facing deeper barriers, including housing instability, involvement with the child welfare system, and chronic absence.
The data supports this reading. Students experiencing homelessness graduated at 76.7% in 2025, a notable jump from 67.1% the prior year but still nine points below the state average. Students in foster care graduated at 60.4%, a rate that has declined from 76.3% in 2018. Students with disabilities graduated at 68.1%, up nearly 10 points since 2010 but still 17.7 points below the overall rate. These are the populations whose outcomes now define the ceiling.
Hawaii's Strive HI Performance System report for 2025 noted statewide gains in math and language arts proficiency and a one-point increase in regular attendance to 76%. But the report framed progress largely as post-pandemic recovery, not as new ground being broken.
State Schools Superintendent Keith Hayashi told the Honolulu Star-Advertiser that recent outcomes "demonstrate what's possible when we align K-12 education with students' futures." But the graduation rate, the department's most visible metric, has not moved.
A shrinking pipeline compounds the stakes
The plateau arrives at a moment when the total number of Hawaii high school graduates is projected to fall sharply. The Western Interstate Commission for Higher Education projects a 33% decline in Hawaii's graduating class between 2023 and 2041, from roughly 11,500 to just over 7,600, the steepest drop of any state. The national average is 10%.
That means the denominator is shrinking. A system that once needed to graduate 86 out of every 100 students to hit its current rate will soon need to graduate 86 out of every 76. If the students who leave the system are disproportionately from families with more resources, the remaining cohorts may be harder to serve, not easier. The same graduation rate could represent a very different educational reality within a few years.
The gender gap offers one piece of genuine progress buried in the plateau. The gap between female and male graduation rates has narrowed from 6.2 points in 2017 to 2.9 points in 2025. Males graduated at 84.4% in 2025, their highest rate on record. But male improvement has roughly tracked female stagnation (females fell from 88.6% in 2021 to 87.3%), which means the narrowing reflects the ceiling as much as real gains.
An 86% rate means roughly one in seven students still does not finish high school on time. The data make clear who they are: Pacific Islander students who have never broken 70%, Native Hawaiian students whose gains have reversed since 2021, students cycling through foster care and temporary housing, and students on the Leeward Coast where the rate has been slipping for three years. That is approximately 2,000 students per graduating class. The tools that lifted the rate from 80% to 86% are not the same tools that will reach them.
Detailed code that reproduces the analysis and figures in this article is available exclusively to EdTribune subscribers.
Discussion
Sign in to join the discussion.
Loading comments...