At Waiakea High, 41.1% of students receiving special education services graduated on time in 2025. At Radford High, 93.3% did. They sit 52.2 percentage points apart in the same state dataset.
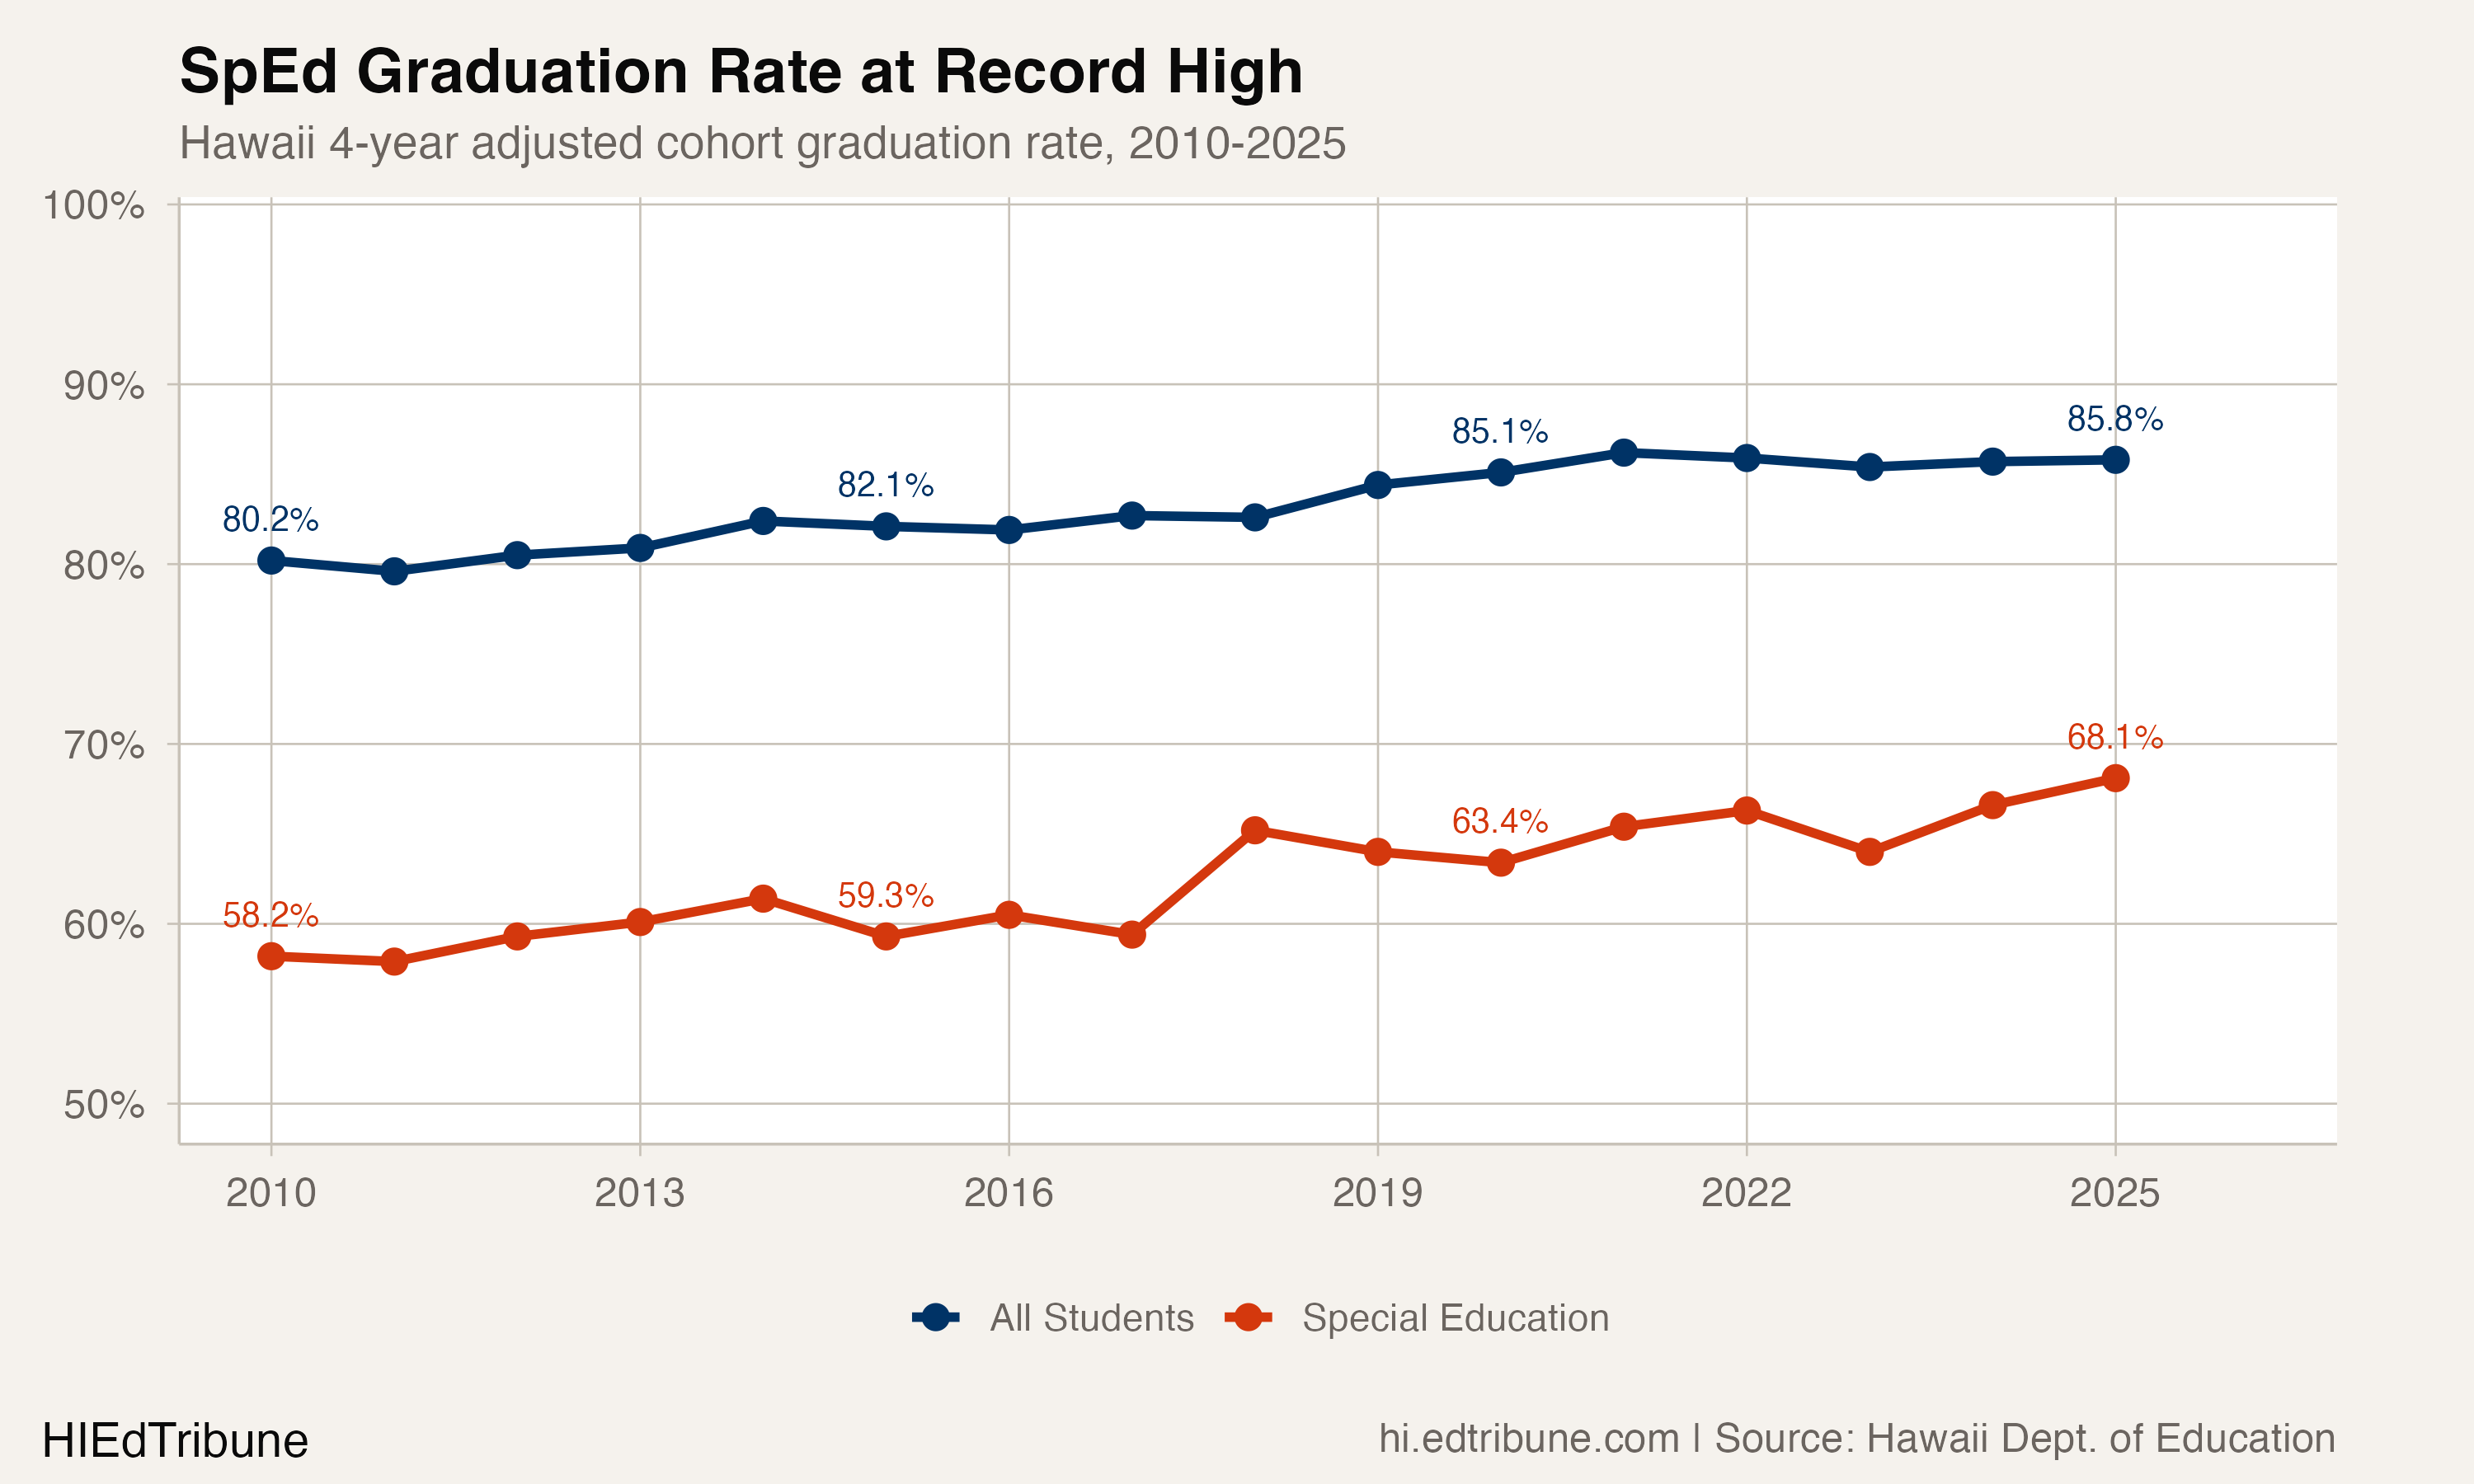
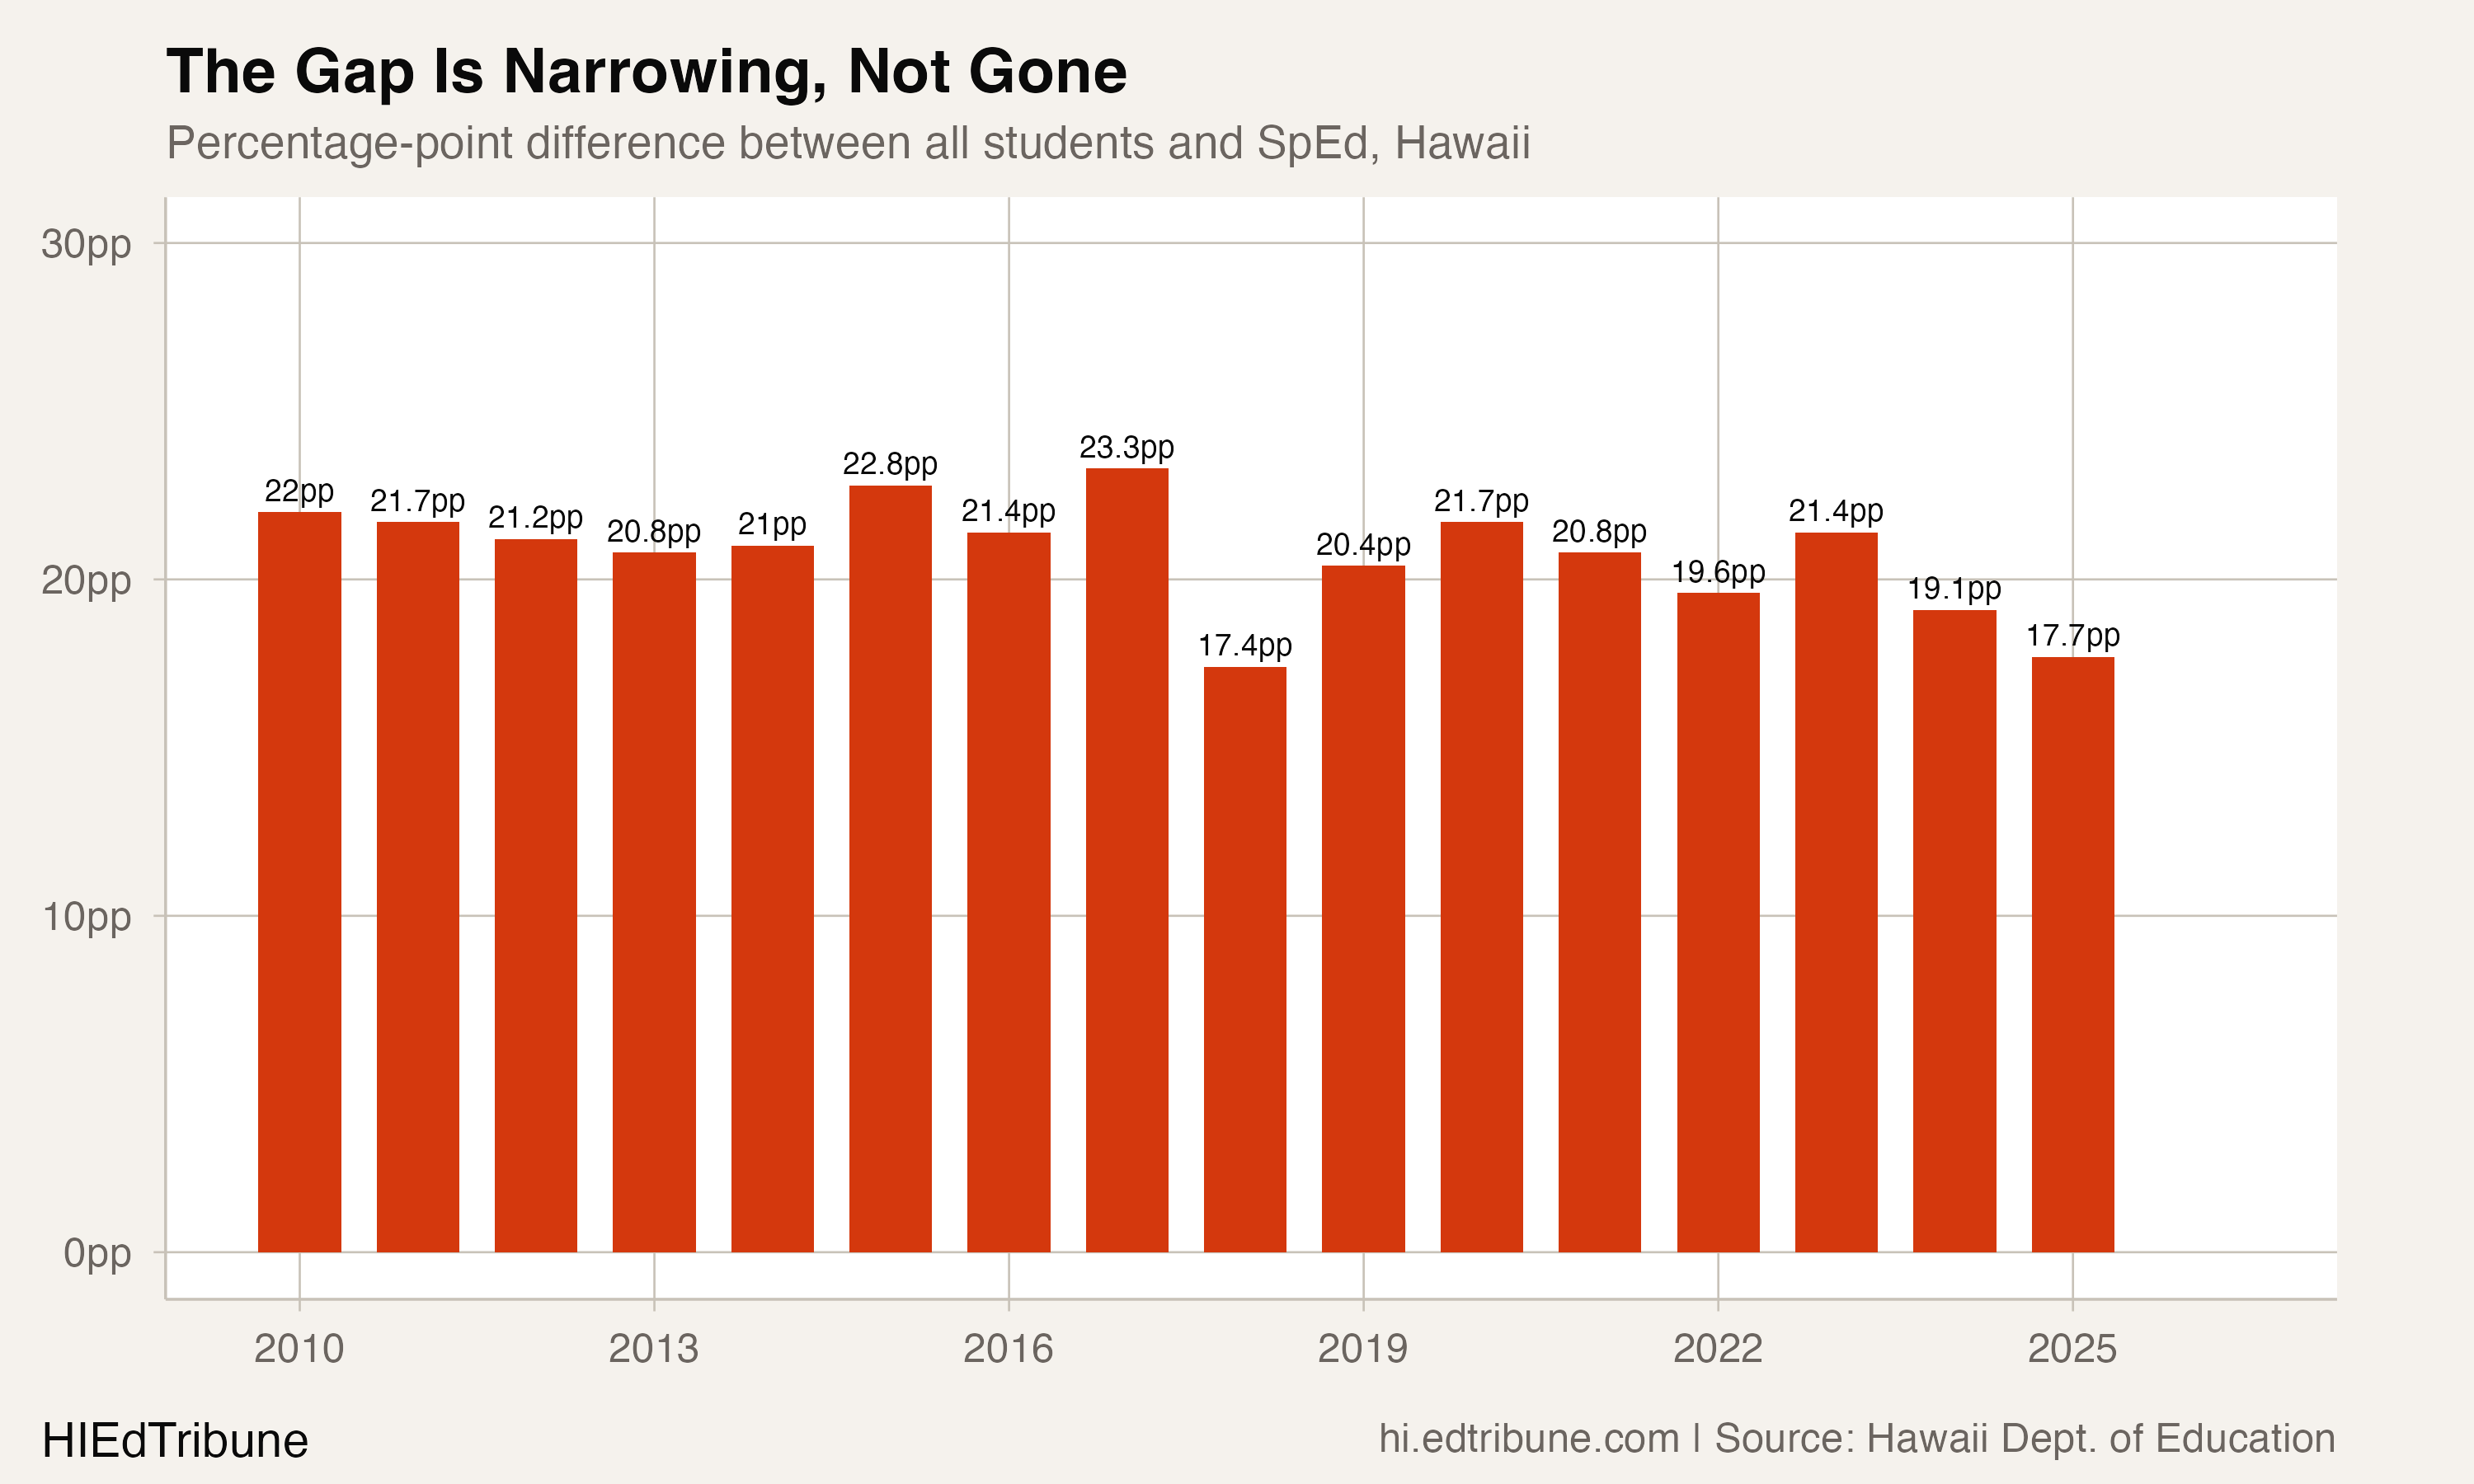
Hawaii's special education graduation rate reached a record 68.1% in 2025, capping a 9.9 percentage-point climb from 58.2% in 2010. The gap with the overall rate of 85.8% narrowed to 17.7 points, down from 22.0 points fifteen years ago.
For a state that went through 12 years of Felix court oversight over special education services, the improvement is sustained.
But the statewide number obscures a landscape where some complex areas graduate nearly nine in 10 special education students and others lose almost half.
The gain that keeps stuttering
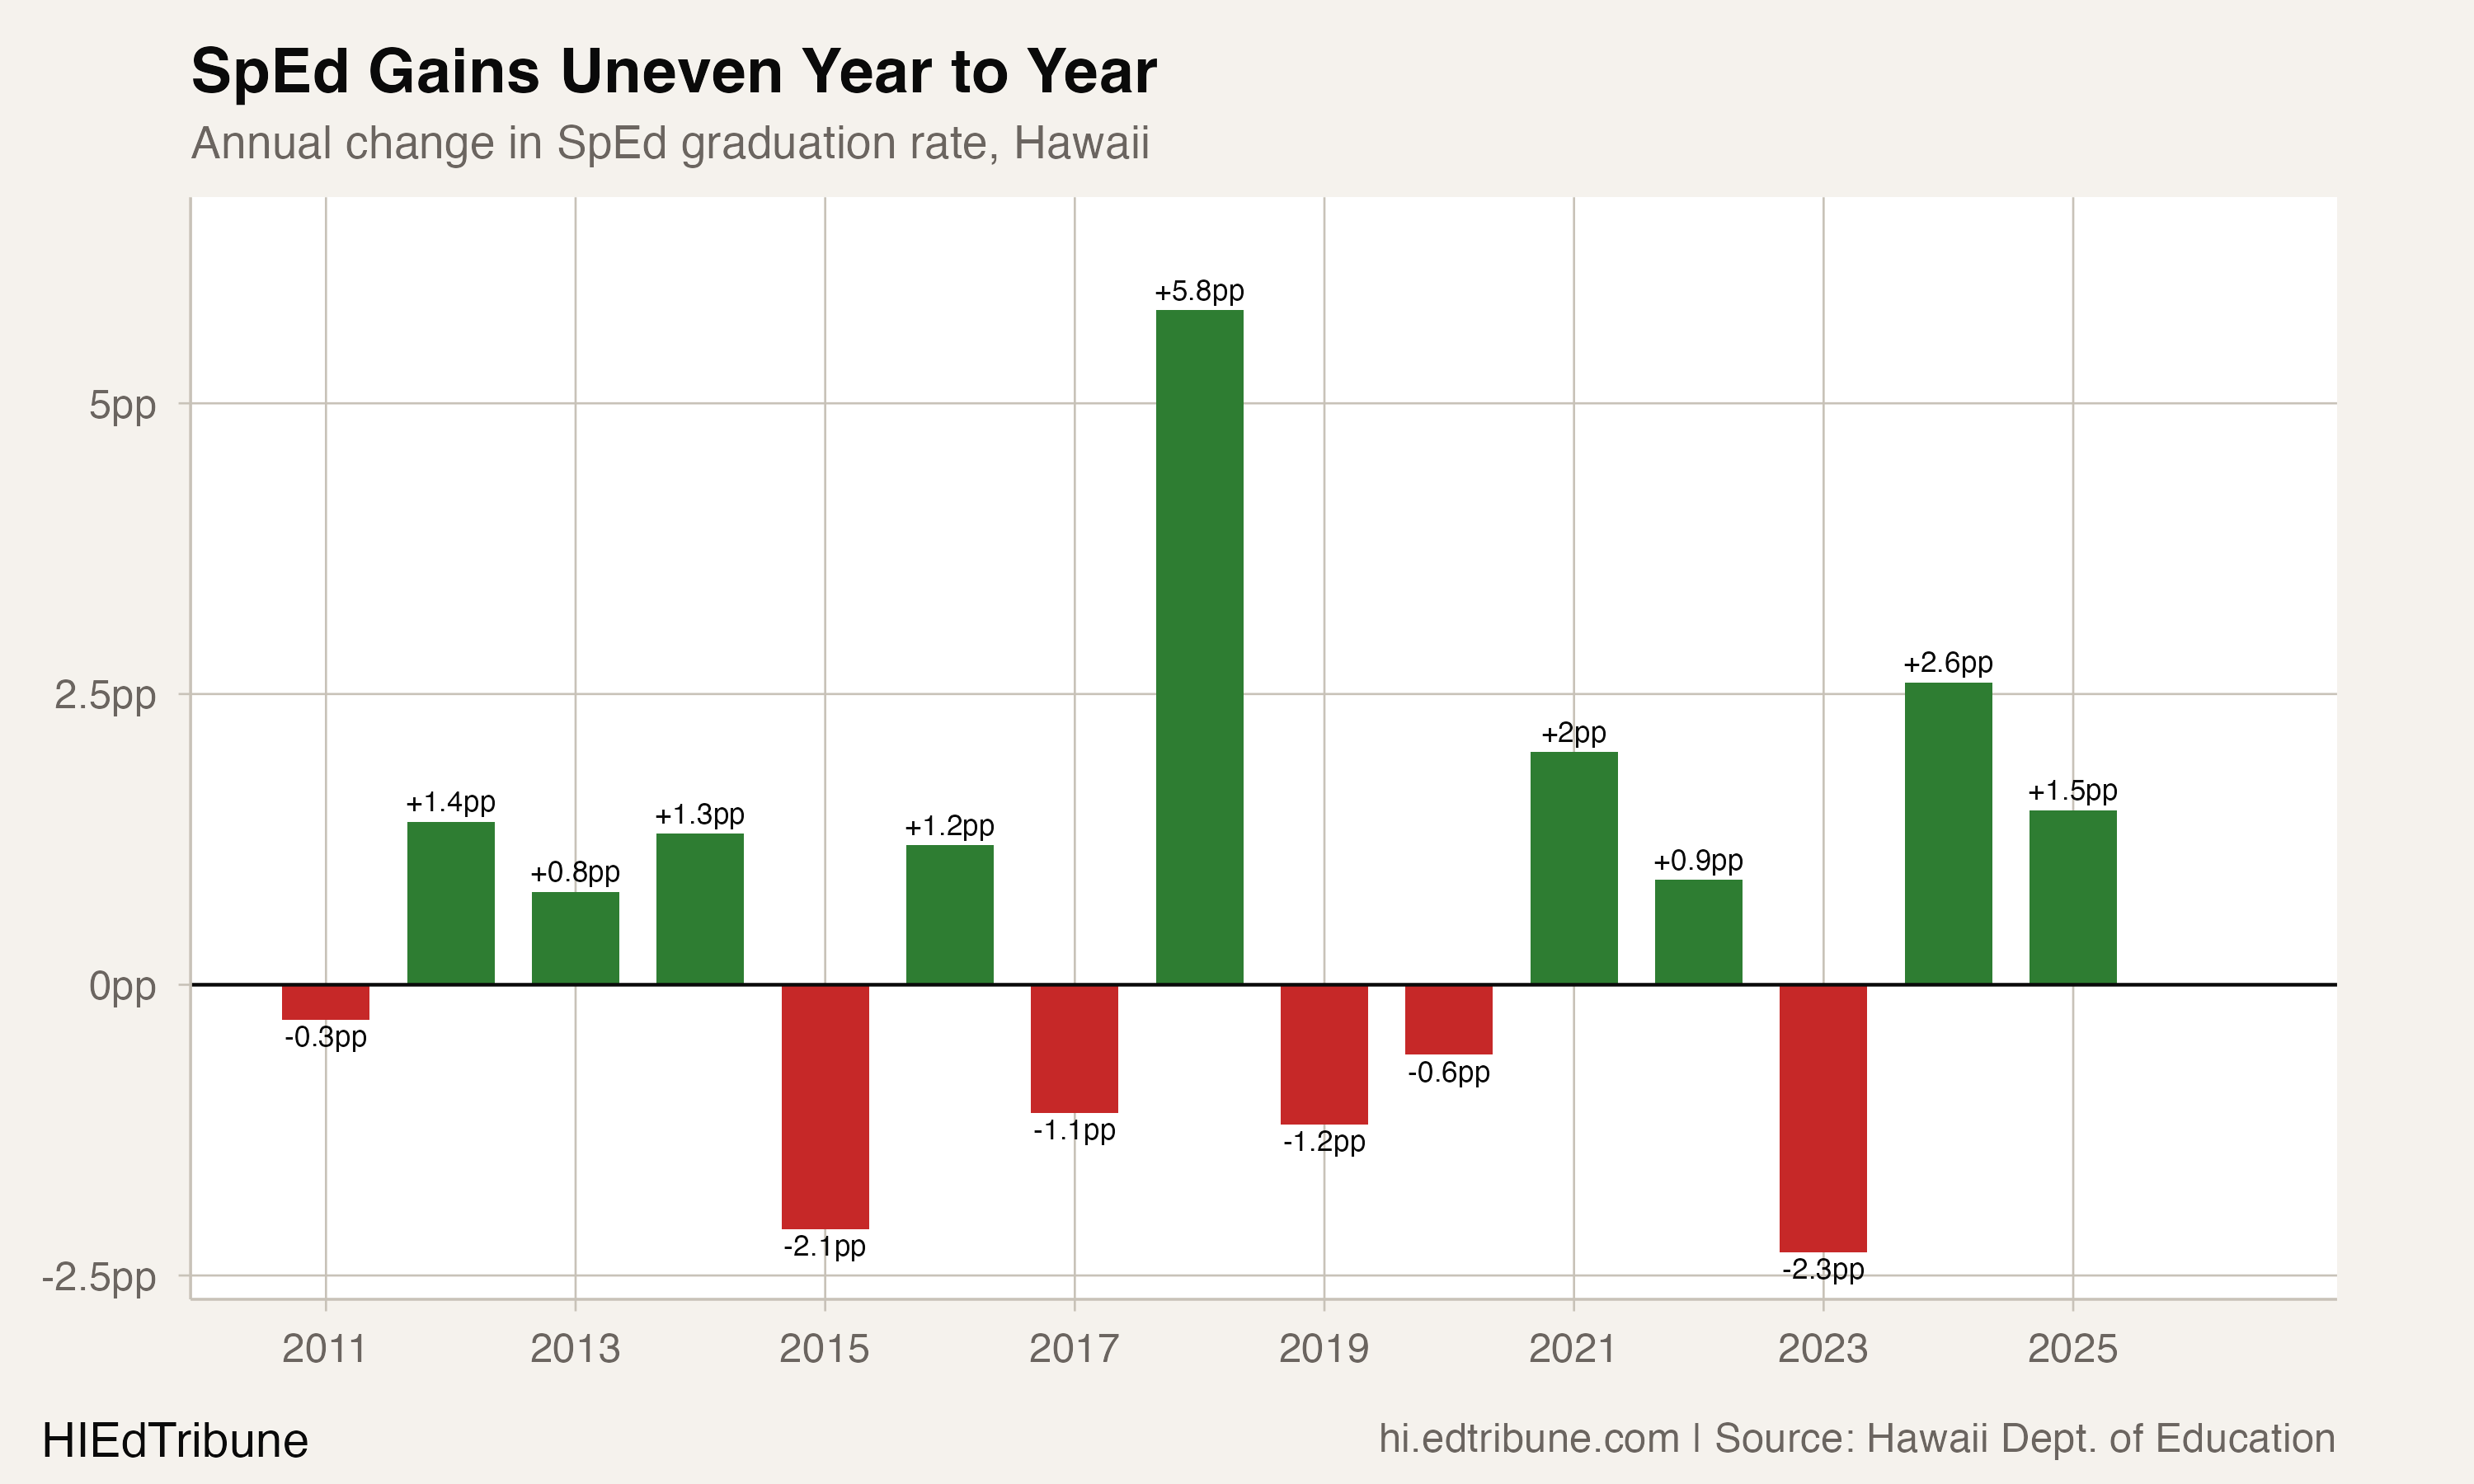
The 9.9-point improvement since 2010 did not arrive in a straight line. For the first seven years, the rate oscillated between 57.9% and 61.4%, going essentially nowhere. Then 2018 brought a 5.8 percentage-point spike in a single year, the largest annual jump in the dataset, vaulting the rate from 59.4% to 65.2%. No corresponding spike appeared in the overall rate, which actually dipped 0.1 points that year.
What followed was equally jarring. The rate fell back to 63.4% by 2020, then climbed to 66.3% in 2022, then dropped 2.3 points to 64.0% in 2023. Only in the last two years has a more consistent pattern emerged: +2.6 points in 2024, +1.5 points in 2025, pushing through to the new high.
The five-year windows tell a clearer story than any single year. From 2010 to 2015, the rate gained 1.1 points. From 2015 to 2020, it gained 4.1 points. From 2020 to 2025, it gained 4.7 points. The improvement is accelerating, but each window includes at least one year where the rate fell.
What 68.1% does and does not measure
The four-year adjusted cohort graduation rate counts students who earn a regular high school diploma in four years. In Hawaii, students with IEPs face a choice between two tracks: a standard diploma, which requires meeting graduation requirements with accommodations, or a Certificate of Completion, awarded when a student finishes the goals in their Individualized Education Program.
Under that regular-diploma definition, the graduation rate counts only diplomas. A student who completes four years on the certificate track does not count as a graduate.
This means the 31.9% of special education students who did not graduate "on time" in 2025 are a mix of students still working toward a diploma, students on the certificate track by IEP team decision, and students who left school. The data cannot distinguish between these outcomes. A low graduation rate at a school could mean students are failing, or it could mean the school serves a population whose IEP plans appropriately lead to certificates rather than diplomas. Without diploma-type breakdowns, the distinction is invisible.
Nearly 33 points between the best and worst complex areas
The statewide 68.1% averages over enormous variation. Hana-Lahainaluna-Lanai-Molokai posted an 87.1% SpEd graduation rate in 2025, actually exceeding the statewide overall rate. Aiea-Moanalua-Radford followed at 81.7%. At the bottom, Hilo-Waiakea graduated 54.4% of its SpEd cohort, and Kau-Keaau-Pahoa managed 55.2%.
The top-to-bottom spread is 32.7 percentage points. Four complex areas were below 62%. Two were above 80%.
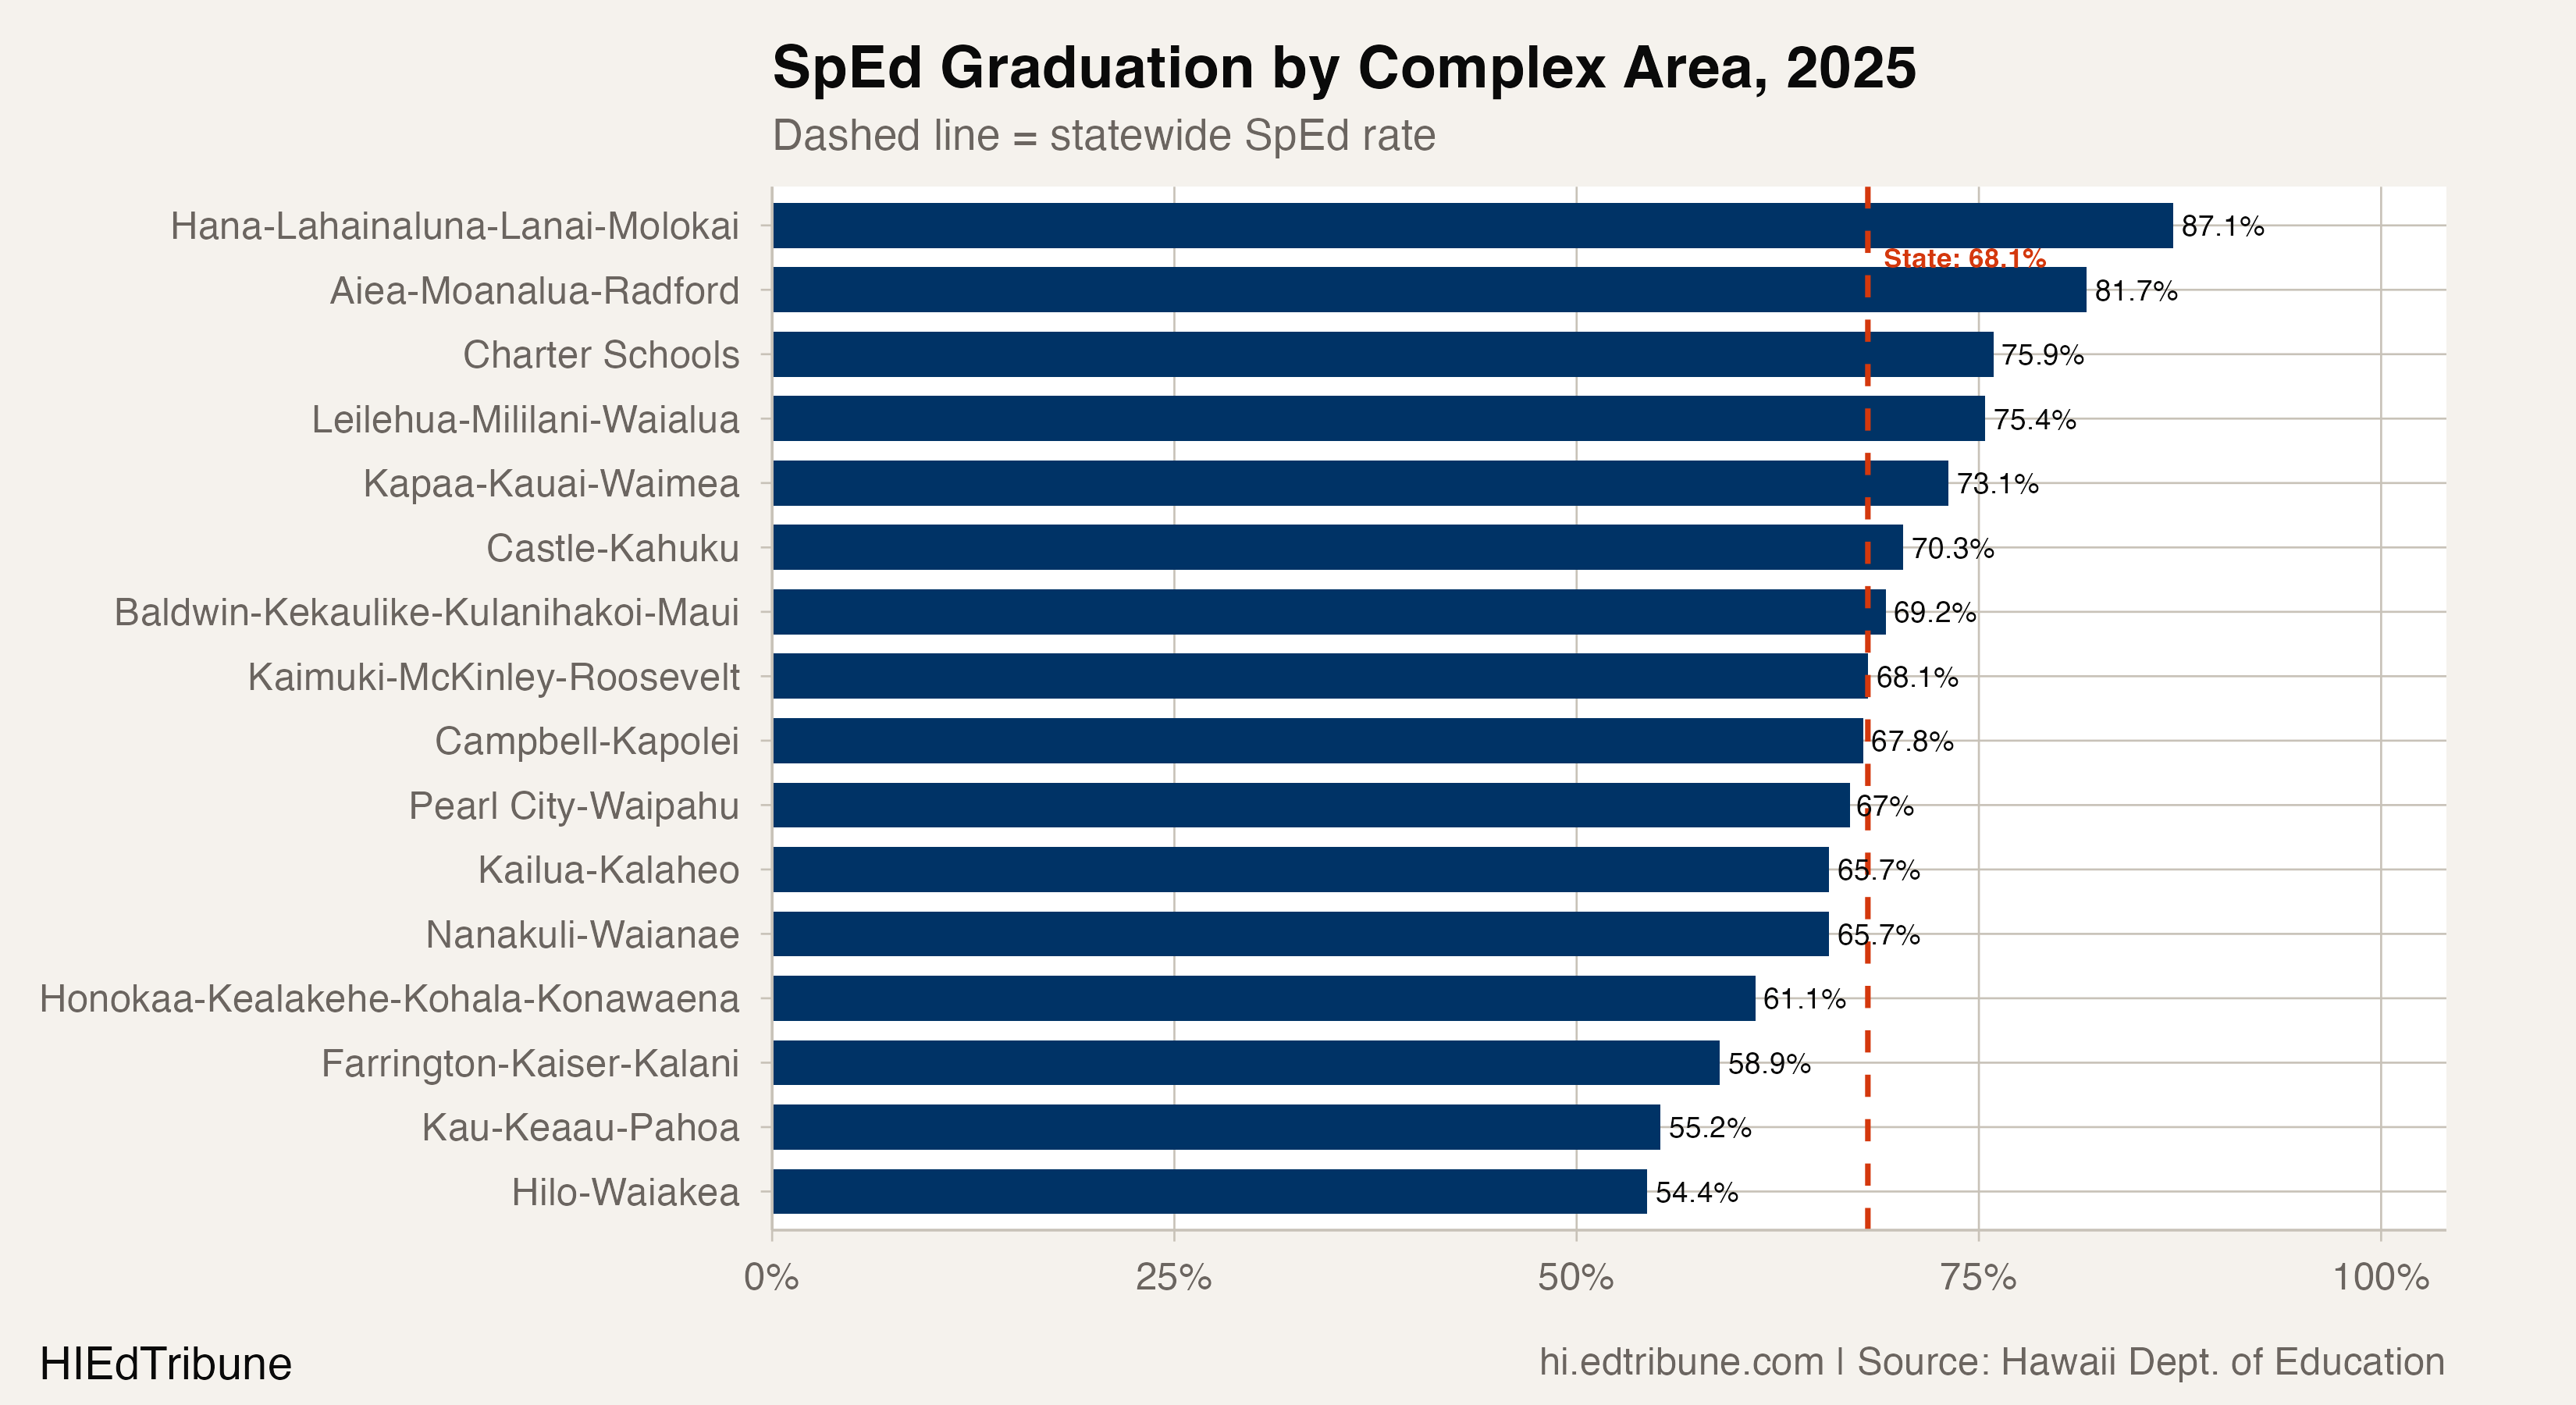
The gaps between overall and SpEd rates vary just as widely. At Hilo-Waiakea, the gap is 30.0 percentage points: the overall rate is 84.4%, the SpEd rate is 54.4%. At Hana-Lahainaluna-Lanai-Molokai, SpEd students actually graduated at a higher rate than the overall cohort, producing a negative gap of 1.6 points. The dataset does not explain why one complex area flips the gap while others still post large gaps; it only shows that the statewide average is hiding very different local outcomes.
Nanakuli-Waianae moved the most
The largest improvement over the full 2010-2025 period belongs to Nanakuli-Waianae, which climbed from a 40.5% SpEd graduation rate to 65.7%, a gain of 25.2 points. Farrington-Kaiser-Kalani gained 18.9 points, and Pearl City-Waipahu gained 17.5.
These are not the highest-performing complex areas. Nanakuli-Waianae's 65.7% still falls below the state average. But the trajectory matters: its SpEd graduation rate rose from 40.5% to 65.7% over the period.
One factor that may have contributed, with a suggestive-context label rather than direct evidence: the Nanakuli-Waianae complex area is among the places where the Department of Education's $10,000 special education teacher differential appears in local staffing data. A Civil Beat analysis found that Nanakuli-Waianae and Hana-Lanai-Molokai, where combined bonuses can reach $18,000 annually, reduced special education teacher vacancies from 14% to 5% over seven years. Those are also among the top SpEd graduation improvers in the dataset. The correlation is not proof of causation, since the graduation data do not link staffing records to individual student outcomes.
Not every complex area improved. Campbell-Kapolei fell 5.7 points, from 73.5% to 67.8%. Kau-Keaau-Pahoa dropped 3.9 points.
Still near the bottom of the subgroup table
Special education is not the lowest reported subgroup in 2025. Foster-care students were lower, at 60.4%. But special education still sat second from the bottom: 68.1%, just below Pacific Islander students at 68.4%, English learners at 71.3%, students experiencing homelessness at 76.7%, and economically disadvantaged students at 80.9%.
The near-bottom standing is persistent. Special education ranked among the three lowest reported state subgroups in every year from 2010 through 2025. The comparison with English learners has flipped over time: English learners were 14.4 points below special education in 2016, when their graduation rate fell to 46.1%, but they were 3.2 points above special education in 2025. The gap with economically disadvantaged students has stayed between 12.6 and 18.5 points since 2015.
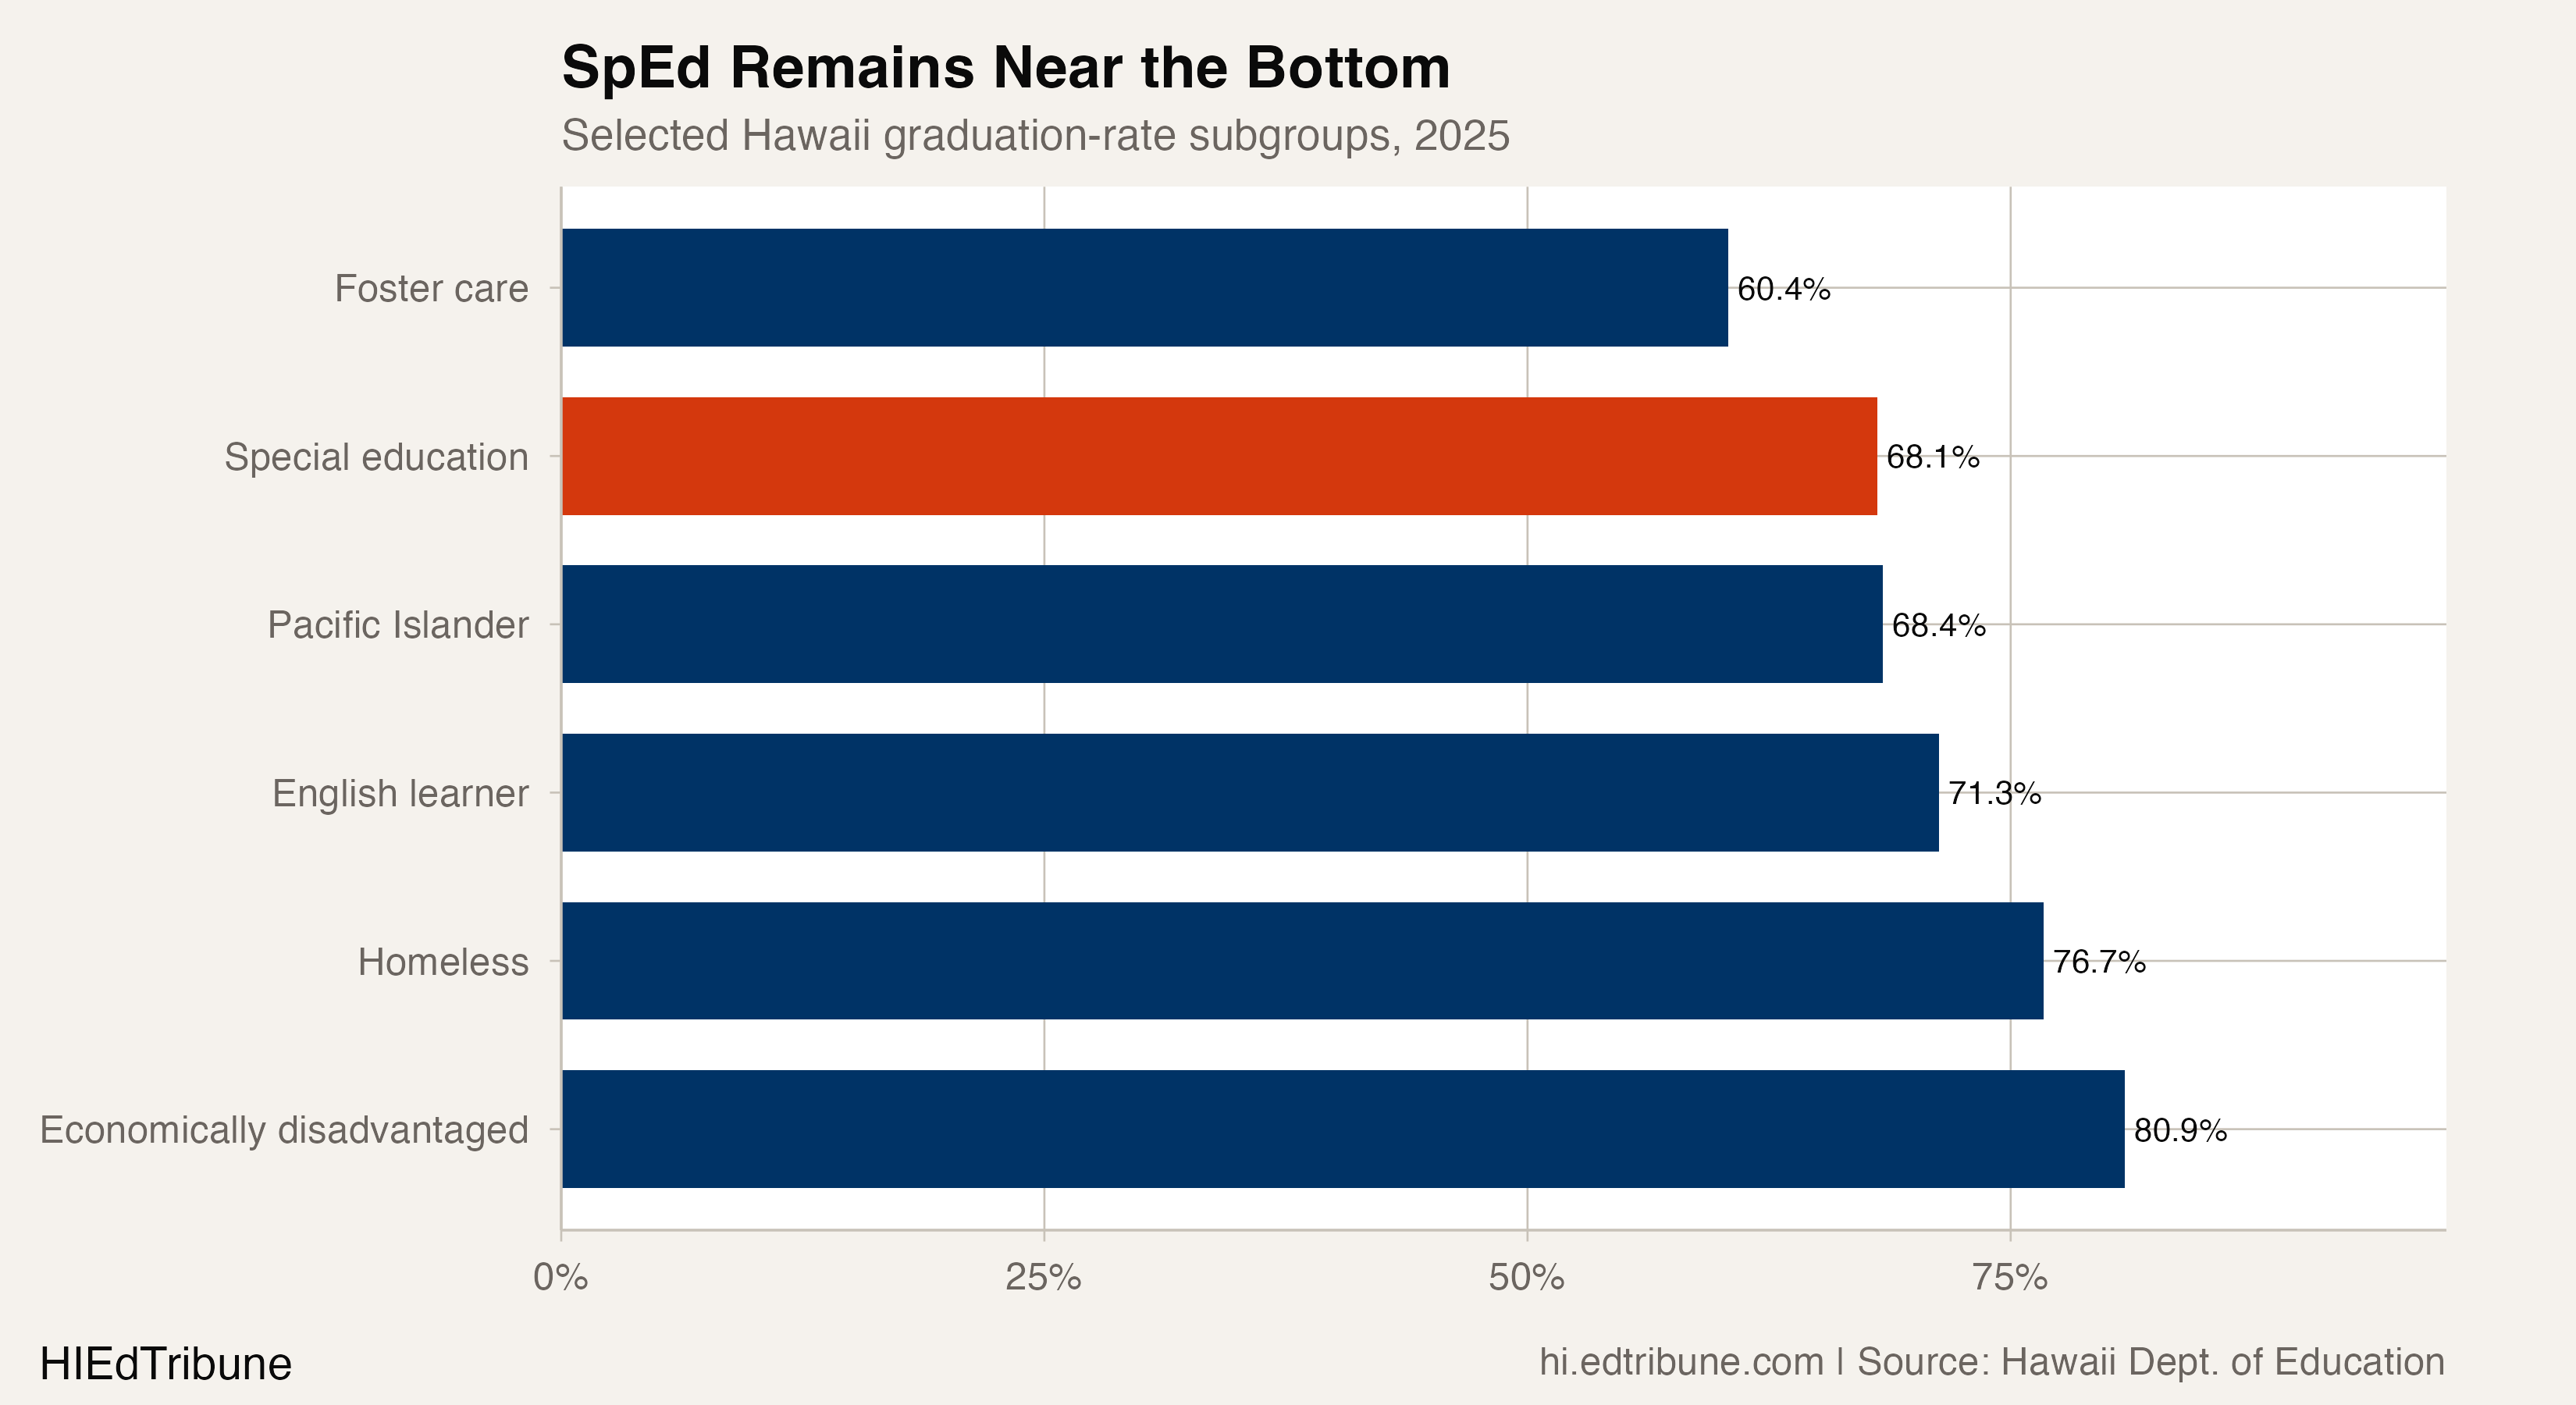
The comparison is imperfect because these populations overlap. A student can be simultaneously classified as special education, economically disadvantaged, and an English learner. But the consistent low ranking points to something specific about the barriers students with disabilities face in reaching an on-time diploma.
Staffing as a ceiling
Hawaii's inclusion rate for special education, the share of students with IEPs spending 80% or more of the school day in general education settings, rose from 41% in 2017-18 to 53% by 2022-23. Civil Beat reported that the state's goal was 61% by 2024-25 and that the 2021 national rate was 67%.
For this graduation story, inclusion is suggestive context, not direct evidence. Students in general education settings have more direct access to grade-level coursework, but the graduation dataset does not identify placement setting or diploma track. It cannot say whether inclusion policy caused the 68.1% rate.
The staffing picture complicates any inclusion push. Despite the nation's largest bonus program for special education teachers, nearly half of newly hired Hawaii educators did not hold a teaching license in the 2024-25 school year, and special education positions accounted for roughly one in five unfilled teaching jobs statewide. Civil Beat also described co-teaching as a model that can strain schools when one special education teacher is already covering multiple grades.
"The models are all over the map." -- Honolulu Civil Beat, Nov. 2023
That assessment, from Andrea Eshelman in a Civil Beat investigation of inclusion practices across Hawaii schools, captures the fragmentation. The graduation data show that outcomes depend heavily on which school and which complex area a student with a disability attends. The external reporting offers one possible reason, but it does not prove the mechanism.
What the record high leaves open
The 17.7-point gap between special education and all students in 2025 is close to the narrowest margin in the full series (2018's 17.4-point gap, before it blew back out to 20+ points the following year). Whether this narrowing proves more durable is the open question.
Two consecutive years of improvement, following the 2021-2022 streak that ended with a 2.3-point drop in 2023, suggest something more than noise. But the same dataset contains at least three instances where a promising year was followed by a reversal: 2014 to 2015 (-2.1pp), 2018 to 2019 (-1.2pp), 2022 to 2023 (-2.3pp). The pattern is of a rate that climbs in bursts and gives ground back.
The durability test is whether a graduation rate moving through a difficult staffing and inclusion environment can hold. The latest state special-education child-count data available for this analysis stop at 2022, but they show the age 6-21 special-education count rising from 9.6% of statewide enrollment in 2020 to 10.3% in 2022. If the 68.1% rate represents a genuine systems improvement, it should hold even as that service footprint grows. If it represents a favorable year, later data can make that clear.
Detailed code that reproduces the analysis and figures in this article is available exclusively to EdTribune subscribers.
Discussion
Sign in to join the discussion.
Loading comments...